
Figure 5.
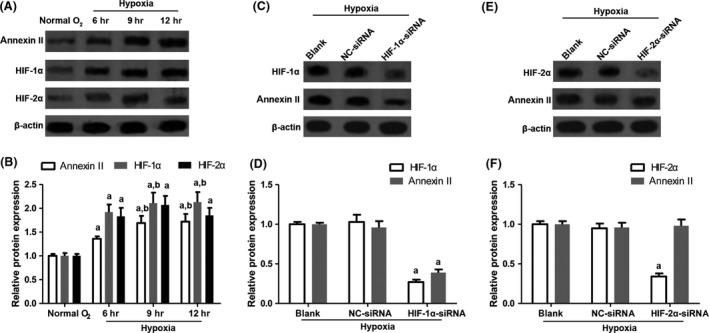
Effect of hypoxia on the expression of annexin II, HIF‐1α and HIF‐2α. (A, B) Raw 264.7 macrophages were exposed to normal condition (20% O2) for 12 hrs or to hypoxic condition (1% O2) for 6–12 hrs. Then, the expression of annexin II, HIF‐1α and HIF‐2α was examined by Western blot. Annexin II: n = 4, F = 11.284, P = 0.038; HIF‐1α: n = 4, F = 21.338, P = 0.018; HIF‐2α: n = 4, F = 17.682, P = 0.024. (C) and (D) The expression of annexin II in macrophages with HIF‐1α knockdown. HIF‐1α: n = 4, F = 23.325, P = 0.015; annexin II: n = 4, F = 21.893, P = 0.018. (E, F) The expression of annexin II in macrophages with HIF‐2α knockdown. HIF‐2α: n = 4, F = 26.314, P = 0.012; annexin II: n = 4, F = 0.894, P = 0.559. a P < 0.05 versus normal O2 group or blank group; b P < 0.05 versus 6 hrs group.