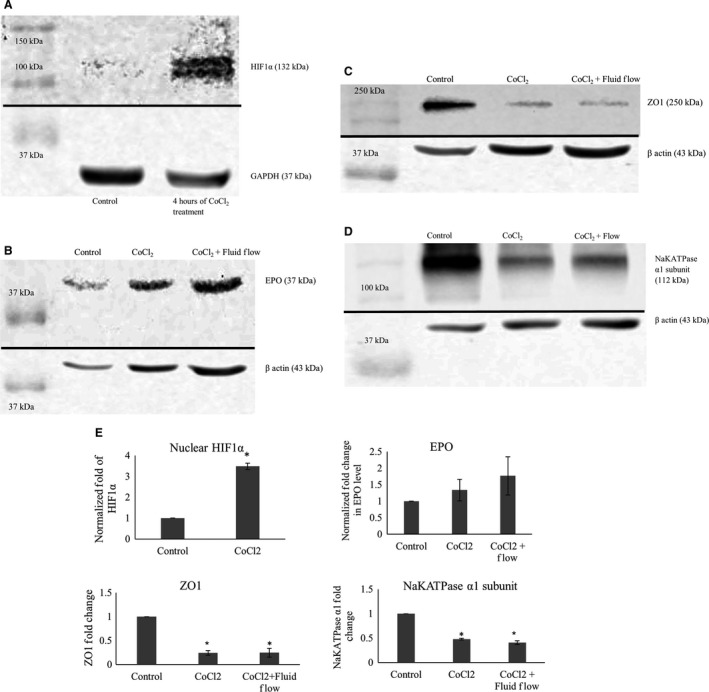
Figure 2.

(A) shows western blots of nuclear extracts of mCCD cells treated with 100 μmol/L CoCl2. Treatment with CoCl2 increased stabilization of HIF1α in the nucleus of the cells. GAPDH levels are shown as loading controls. (B) shows western blots of whole cell extracts of mCCD cells treated with 100 μmol/L CoCl2 for 4 h. As shown in the images, treatment with CoCl2 increased the EPO production by cells. Beta actin levels are shown as loading controls. (C) shows western blots of whole cell extracts of mCCD cells treated with 100 μmol/L CoCl2 for 4 h and chronic fluid flow. As shown in the images, treatments decreased ZO‐1 production by cells independently of fluid flow stimulation. Beta actin levels are shown as loading controls. (D) shows western blots of whole cell extracts of mCCD cells treated with 100 μmol/L CoCl2 for 4 h and chronic fluid flow. As shown in the images, treatments decreased NaKATPase production by cells independently of fluid flow stimulation. Beta actin levels are shown as loading controls. (E) Densitometric analysis of Western blots presented in (A–D). HIF1α level: P = 0.004 (N = 3), t‐test, showing significant nuclear stabilization of HIF1α. EPO level: increases slightly though not statistically significant (N = 3, P > 0.05, One‐way ANOVA). ZO‐1 level: P < 0.0001 (N = 4), One‐way ANOVA, showing significant decrease in ZO‐1 levels, independent of fluid flow. NaKATPase α1 subunit level: P = 0.001 (N = 3), One‐way ANOVA, showing significant decrease in NaKATPase α1 subunit levels, largely independent of fluid flow.
