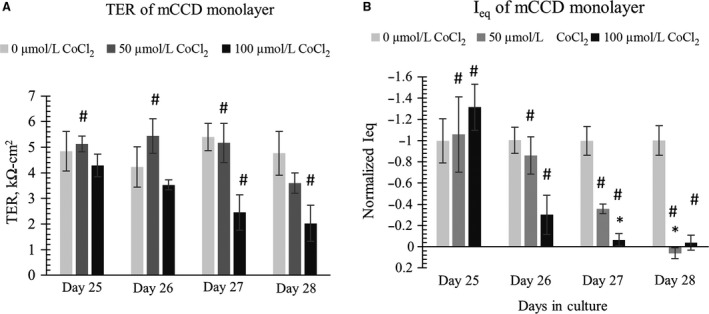
Figure 10.

CoCl2 was withdrawn from apical media and added to basolateral media on day 25. Data shows that application of 100 μmol/L CoCl2 to basolateral media significantly decreased (left) TER values and (right) I eq values of differentiated mCCD monolayers in a dose‐dependent manner after 2 days of treatment (N = 5–6). In the TER and I eq data, One‐way ANOVA shows no significant (P > 0.05) TER and I eq changes among control groups. In the TER plot, * denotes significant change (P < 0.05) among 0 μmol/L CoCl2, 50, and μmol/L 100 CoCl2 treatment at a specific time‐point. # denotes CoCl2 treatment causes significant change (P < 0.05) between CoCl2‐treated sample at a specific time point with CoCl2‐treated or control sample at a different time point. In figure (A) we do not see statistically significant decrease in TER, * (P < 0.05) on day 27 or day 28 by 50 or 100 μmol/L CoCl2 as compared to control (0 μmol/L CoCl2) on that specific day. However, we notice some significant decrease in TER as compared to control at a different time point. For example on day 28, 100 μmol/L CoCl2 causes significant decrease in the TER value when compared to 0 μmol/L CoCl2 TER value on day 27, denoted by #. In figure (B) we notice significant loss of I eq with 100 μmol/L CoCl2 treatment on day 27 and significant loss of I eq with both 50 and 100 μmol/L CoCl2 treatment on day 28. Not all significance (#) are shown in the graph; all # are marked onto any noticeable change and applicable to group treated with CoCl2.
