
Figure 1.
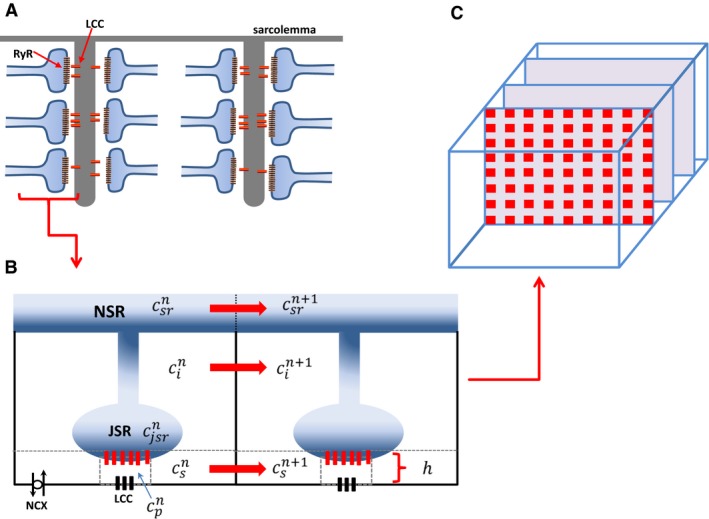
(A) Schematic illustration of the spatial architecture of Ca2+ signaling in a cardiac ventricular cell. Signaling between channels occurs within dyadic junctions distributed in the 3‐D volume of the cell. (B) Illustration of two nearest neighbor signaling units (Ca2+ release units [CRUs]) showing the subcellular compartments. Here, the superscript denotes the CRU in a 3‐D grid representing the cell. The spacing between LCC and RyR channels is denoted by the variable . (C) Spatial architecture of the cell interior showing Z‐planes.