
Figure 4.
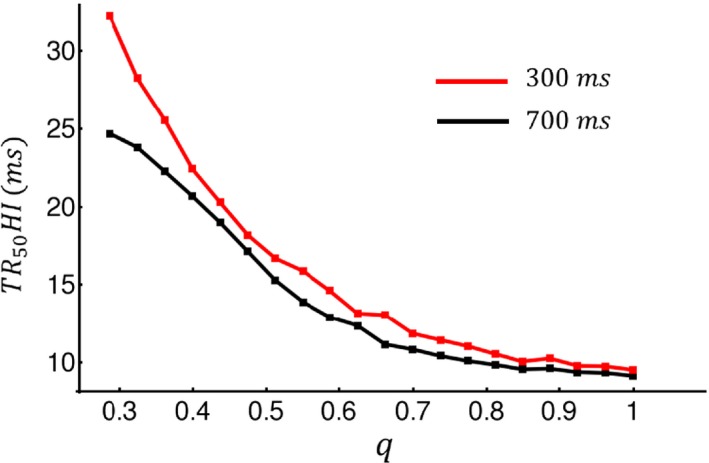
Plot of TR50 HI versus q at cycle length 300 msec and 700 msec. TR50HI was computed by measuring the time to half maximum within 60 junctions along the longitudinal direction. The computed standard deviation was then averaged over 100 independent simulations.