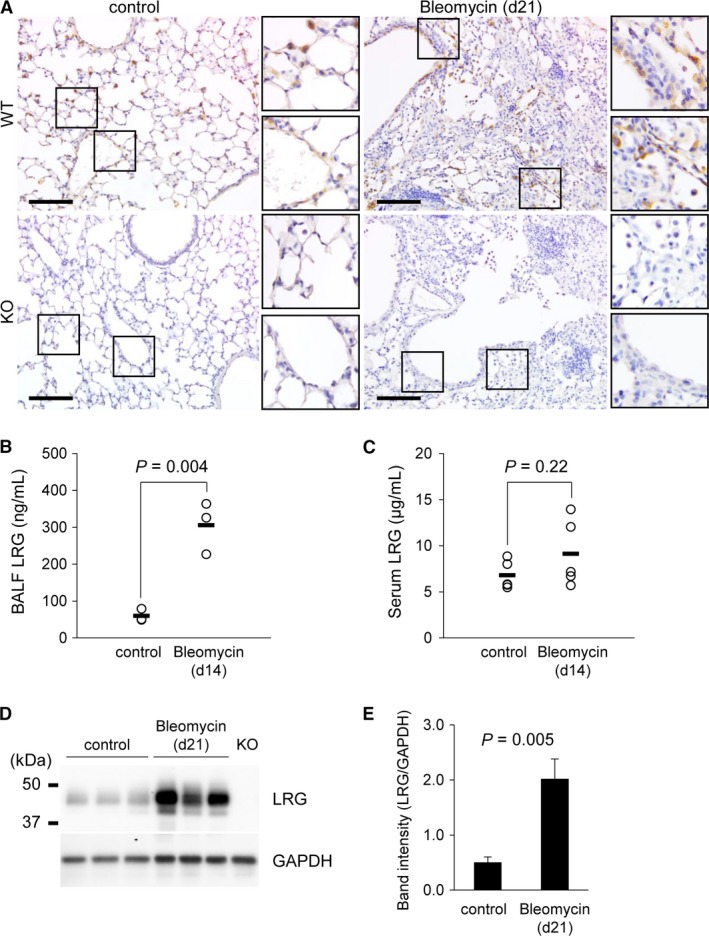
Figure 1.

Change in the lung LRG level caused by bleomycin administration. (A) Immunohistochemical analysis of LRG in the control and bleomycin‐administered lung at day 21 from WT and KO mice. Scale bar = 100 μm. (B and C) Concentrations of LRG in BALF (B; n = 3) and sera (C; n = 5) of WT mice 14 days after bleomycin administration measured by ELISA. The bars (▬) show mean values (B: control: 60.0 ng/mL, Bleomycin: 305.8 ng/mL; C: control: 6.8 μg/mL, Bleomycin: 9.1 μg/mL). (D) Western blot analysis of LRG in the lungs from control and 21 days after bleomycin‐administered mice. GAPDH was used as an internal control. The protein extract from a LRG KO mouse lung was used as a negative control. (E) Quantification of LRG band intensity normalized to GAPDH (n = 3). Data were shown as mean ± SD.
