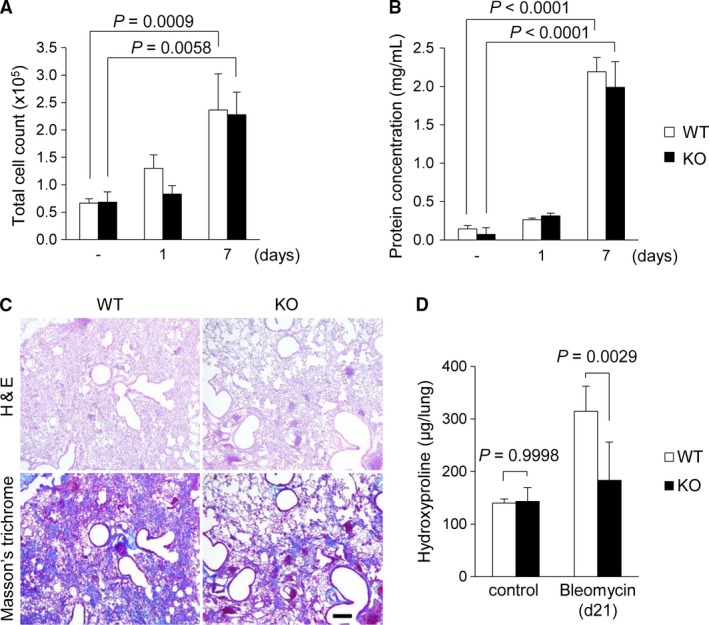
Figure 2.

Comparison of inflammatory and fibrotic responses in the lungs between WT and LRG KO mice after bleomycin administration. (A and B) Total cell counts (A) and concentration of total protein (B) in BALF collected from WT and KO mice with or without bleomycin treatment (n = 3–5 per group). Mice were sacrificed on day 1 and day 7 after bleomycin treatment for BALF collection. (C) H&E staining and Masson's trichrome staining of the lungs of WT and KO mice 21 days after bleomycin administration. Scale bar = 100 μm. (D) Hydroxyproline contents of the whole lung of WT and KO mice measured by colorimetric method (n = 3–7 per group). One way ANOVA followed by Tukey's test was used for statistical analysis.
