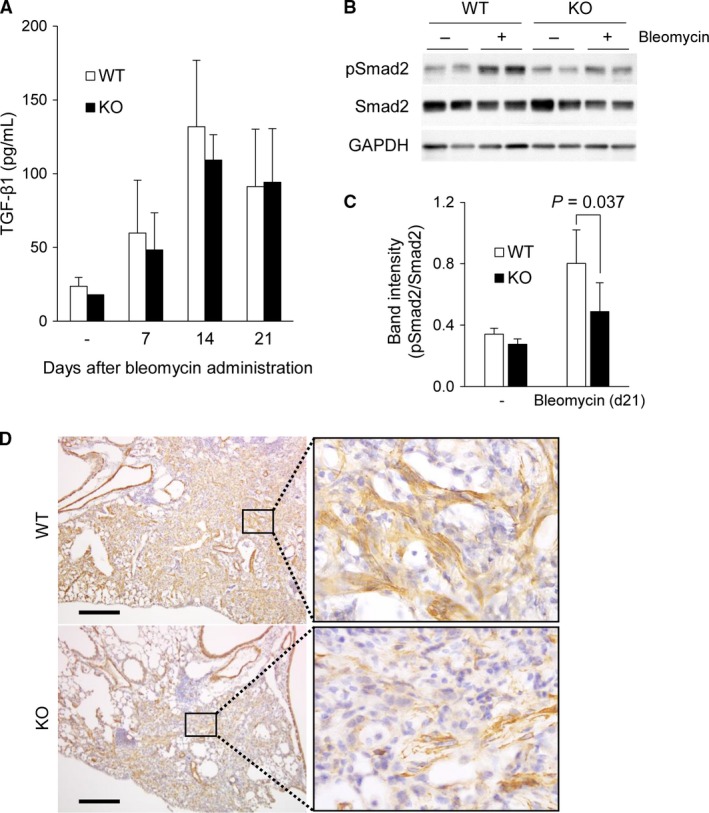
Figure 3.

Concentration of TGF‐β1 in BALF and activation of Smad2 signaling in lungs from WT and LRG KO mice after bleomycin administration. (A) Comparison of TGF‐β levels in BALF between WT and LRG KO mice untreated (‐), and 7, 14 and 21 days after administration measured by ELISA (n = 3–5 per group). (B) Phospho‐Smad2 and Smad2 levels in the lungs of WT mice and KO mice 21 days after bleomycin administration detected by western blot analysis. GAPDH was used as an internal control. (C) Quantification of pSmad2 band intensity normalized to Smad2 (n = 5). Data were shown as mean ± SD. (D) Immunohistochemical analysis of α‐SMA in the lungs of WT and KO mice 21 days after administration. Scale bar = 200 μm.
