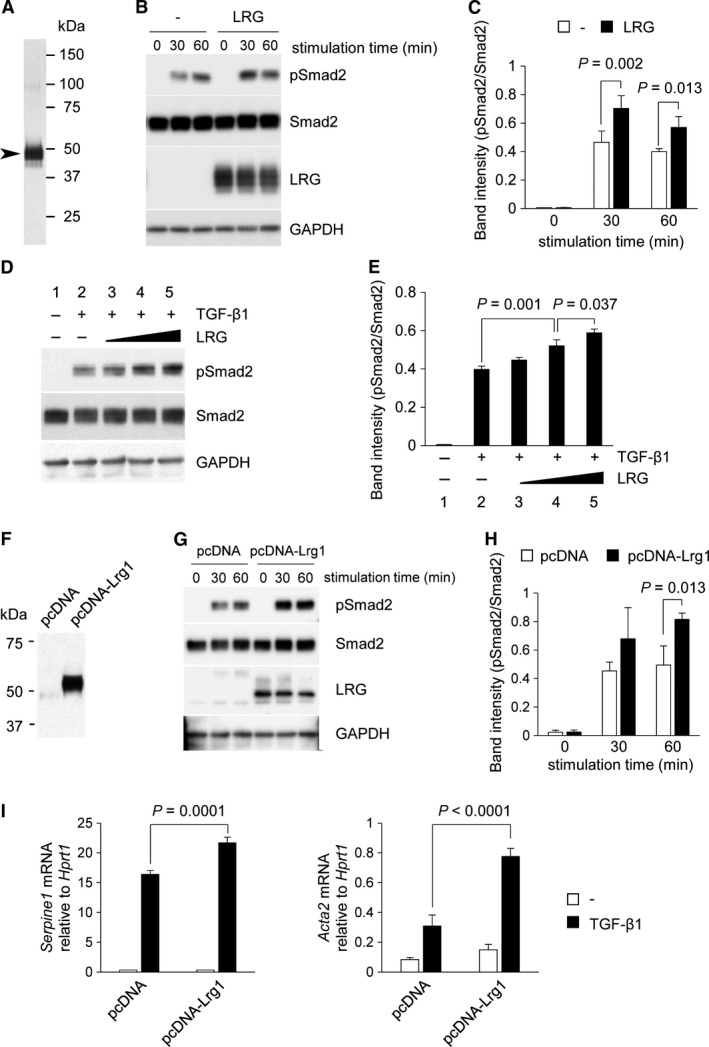
Figure 4.

Effect of LRG on TGF‐β‐induced Smad2 phosphorylation and downstream gene expression in L929. (A) Silver staining of affinity‐purified recombinant mouse LRG obtained from the culture supernatant of recombinant mouse LRG‐expressing A549 cells using an anti‐LRG antibody‐conjugated column. The sizes of molecular weight markers are indicated on the right lane. The size of the major band (indicated by arrowhead) corresponded to that of LRG (45–50 kDa). (B and C) Detection of phospho‐Smad2 by western blot analysis. L929 cells were treated with or without 20 μg/mL of LRG for 24 h. Cells were then stimulated with 2 ng/mL of TGF‐β1 for 0, 30, and 60 min. Anti‐phospho‐Smad2 (Ser465/467), anti‐Smad2, anti‐LRG, and anti‐GAPDH antibodies were used for the detection. Band intensity of pSmad2 normalized to Smad2 is shown in Figure 4C (n = 3). (D and E) Detection of phospho‐Smad2 by western blot analysis. L929 cells were treated without (lanes 1 and 2) or with 0.035 μg/mL (lane 3), 0.35 μg/mL (lane 4), and 3.5 μg/mL (lane 5) of LRG for 24 h and then with 2 ng/mL of TGF‐β1 for 30 min. Band intensity of pSmad2 normalized to Smad2 is shown in Figure 4E (n = 3). (F) Detection of LRG in culture supernatants of pcDNA‐Lrg1 (containing full length LRG cDNA) but not in those of pcDNA (vector without insertion). Supernatants from L929 cells after 24‐h culture in serum‐starved media were analyzed by western blot. (G and H) Detection of phospho‐Smad2 in pcDNA‐Lrg1 and pcDNA cells after treatment with 2 ng/mL of TGF‐β1 for 0, 30, and 60 min. Band intensity of pSmad2 normalized to Smad2 is shown in Figure 4H (n = 3). (I) qPCR analysis of Serpine1 and Acta2. L929 cells were treated with 2 ng/mL of TGF‐β1 for 6 h for Serpine1 or for 12 h for Acta2. The relative expressions of Serpine1 and Acta2, normalized to Hprt1 gene expression are shown.
