Figure 5.

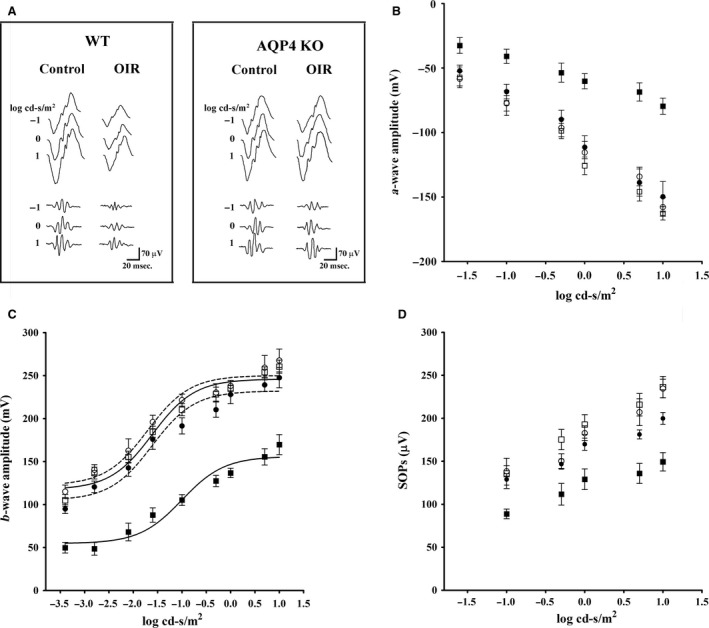
ERG responses in WT and AQP4 KO mice at PD17. (A) Representative ERG waveforms in both WT and AQP4 KO mice, either controls or OIR, recorded at light intensities of ‐1, 0 and 1 log cd‐s/m2. (B–D) a‐wave, b‐wave and SOP amplitudes in normoxic controls (white symbols) and OIR (black symbols) either WT (squares) or AQP4 KO (circles) at increasing light intensities. AQP4 deletion prevented the OIR‐induced reduction in a‐waves, b‐waves and SOPs that characterize OIR. Data are presented as mean ± S.E.M. (n = 6 mice, P < 0.001 versus OIR WT. Two‐way anova followed by Bonferroni's post‐test).
