Figure 2.

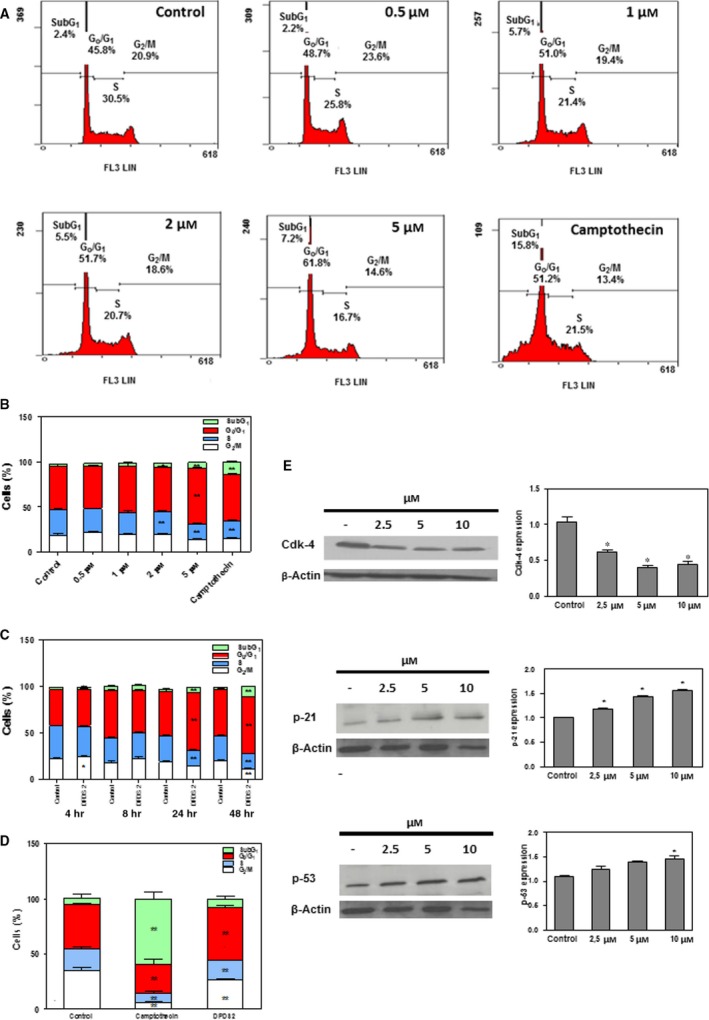
DPDS 2 induces G0/G1 cell cycle arrest in CCRF‐CEM cells. CCRF‐CEM cells were exposed to 0.5, 1, 2 and 5 μM DPDS 2 or vehicle for 24 hrs. After incubation, cells were processed for propidium iodide staining, and their cellular DNA content was determined by flow cytometry. Positive controls contained camptothecin at the same concentration as DPDS 2. (A) Flow cytometry analysis of a representative experiment. (B) The results are expressed as percentages of total cell counts. (C) Time course analysis of cell cycle phase distribution after incubation of the cells with 5 μM of DPDS 2. (D) Cell cycle phase distribution of MOLT‐4 cell cultures after treatment with 20 μM DPDS 2 for 24 hrs. (E) Western blot analysis of CDK4, p21CIP1 and p53 in CCRF‐CEM cells treated with 2.5, 5 and 10 μM of compound DPDS 2 for 24 hrs. The results are the mean ± S.E.M. of at least three independent experiments. *P < 0.05 and **P < 0.01 compared with control cells.
