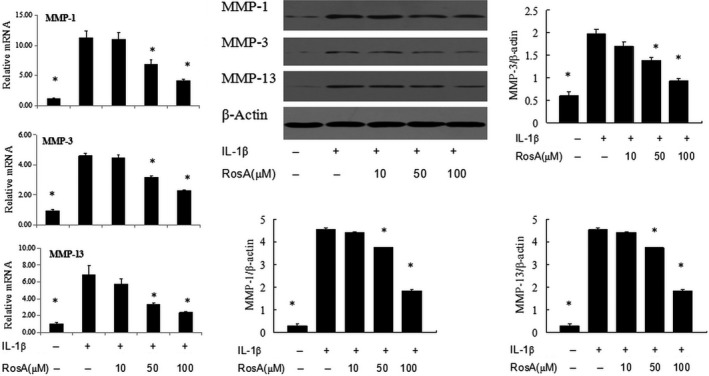
Figure 4.

Effect of RosA on MMP‐1, MMP‐3 and MMP‐13 expression in chondrocytes. Cells were treated with RosA for 1 hr prior to treatment with IL‐1β (10 ng/ml) and were collected after 24 hrs. Quantitative real‐time PCR and Western blot analyses were performed to analyse MMP‐1, MMP‐3 and MMP‐13 mRNA and protein expression, respectively. Data are expressed as mean ± standard deviation (SD). *P < 0.05 compared with cells stimulated with IL‐1β only.
