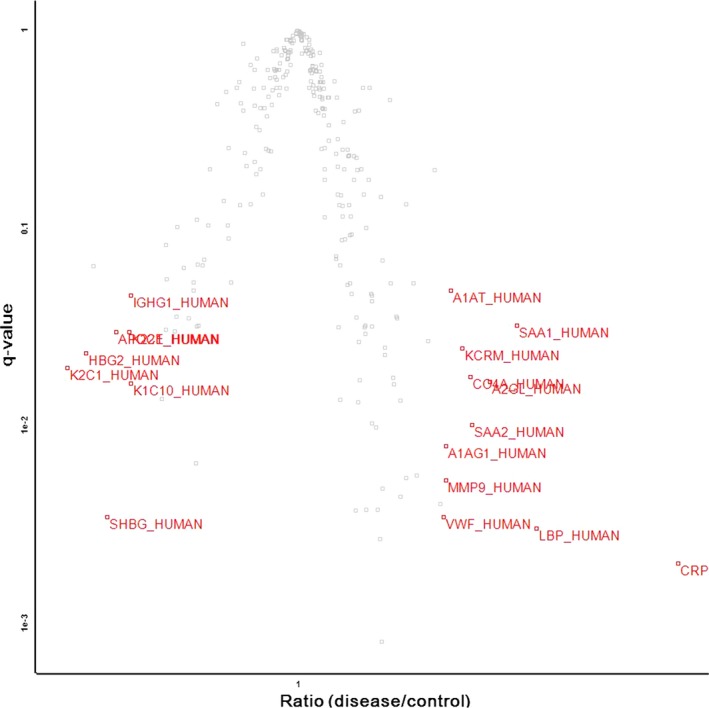
Figure 1.

Volcano plot representation of totally identified protein results showing the ratio (x‐axis) and significance (q values, y‐axis). The volcano plot indicates that 20 proteins were significantly (q value < 0.05) differentially (ratio ≥1.42 or ≤0.70) expressed in the CS group compared with the normal control group. The accession numbers of each differentially expressed protein are shown in red.
