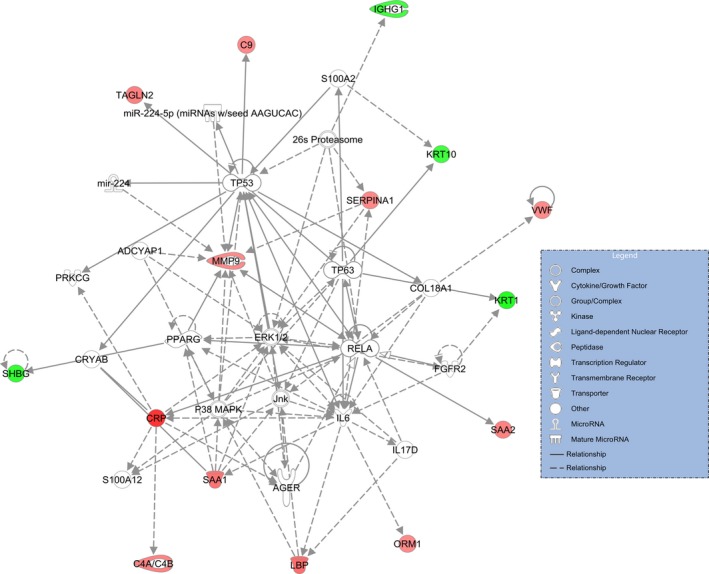
Figure 3.

The top molecular network generated by IPA software for 20 differentially expressed proteins in serum of CS versus control. The modulated proteins are classified by established relationships into the functional analysis of a network. Solid line indicates direct interaction, and dashed line means indirect interaction.
