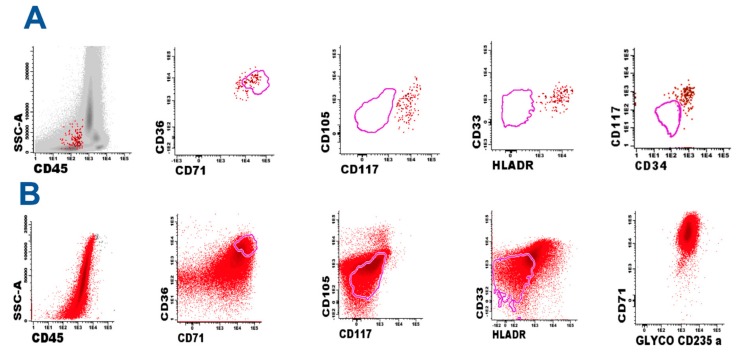
Figure 2.
(A) Identification of minor population of erythroid leukemic cells (red dots), cluster of differentiation 45− (CD45−), CD34+/−, CD36+, CD71+ with abnormal expression of CD105, CD117, Histocompatibility Leukocyte Antigen-D Related (HLADR), and CD33. The correct characterization of these mild changes requires comparison with reference images obtained from normal counterpart (pink line); (B) Identification of blast cells in tissue biopsy. Standardized eight-color flow cytometry (FC) demonstrated a homogeneous population similar (not identical) to the previously identified population in a bone marrow sample. Comparison with reference images demonstrated alterations in the expression of CD36, CD71, CD33, and HLADR. The intense homogeneous positivity to glycophorin A demonstrates the pure erythroid nature of the process.

