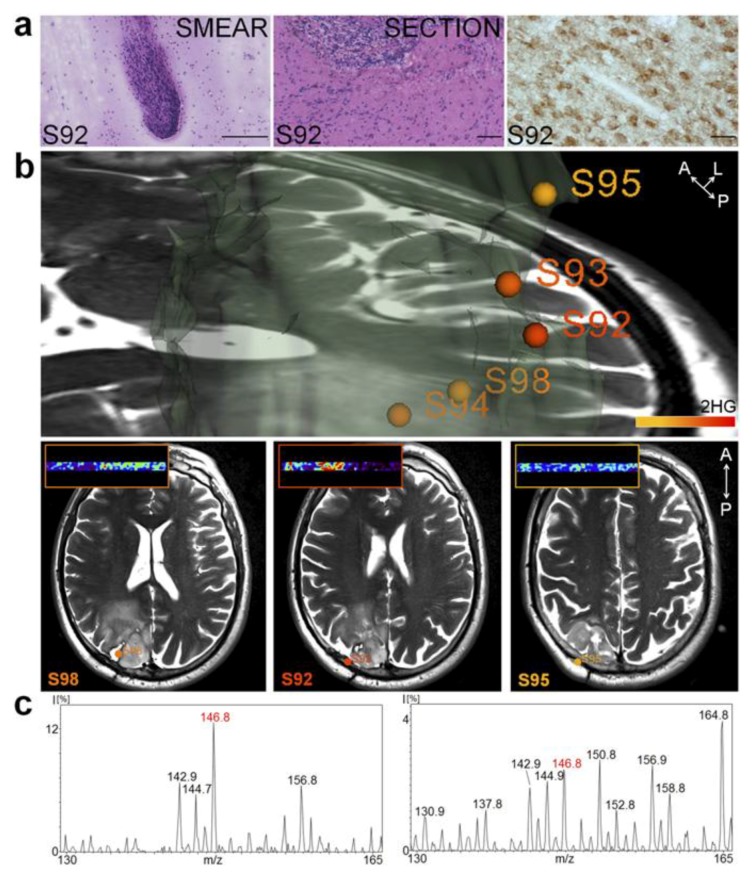
Figure 3.
Intraoperative mass spectrometry of an onco-metabolite to guide brain tumor resection. (a) H & E-stained smear (Left), frozen tissue section (Center), and immunohistochemistry using an IDH1 R132H point mutation-specific antibody in an oligoastrocytoma grade III samples; (b) 3D tumor volume representation showing normalized 2-hydroxyglutarate (2-HG) signal represented with a warm color scale (lowest (yellow) to highest (red)); (c) Negative ion mode DESI mass spectra obtained from a smear (Left) and a section from an oligoastrocytoma grade III (Right). Used with permission from Santagata et al. [82].

