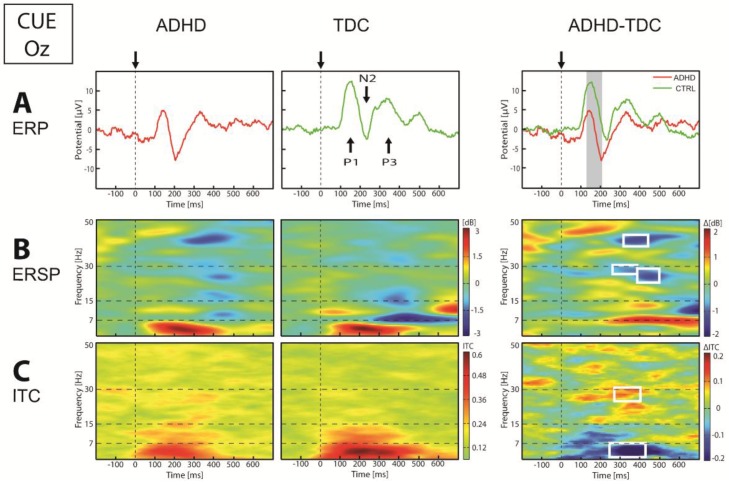
Figure 3.
Event-related potentials (ERP) (A), event-related spectral perturbation (ERSP) (B) and inter-trial coherence (ITC) (C) in Oz electrode in response to Cue stimulus. On the ERP panel: arrows and vertical dotted lines indicate stimulus onset, vertical gray band indicates significance at p < 0.05. On the ERSP and ITC panel: vertical dotted lines indicate stimulus onset, horizontal dotted lines define frequency bands, and white square indicate significance at p < 0.05.

