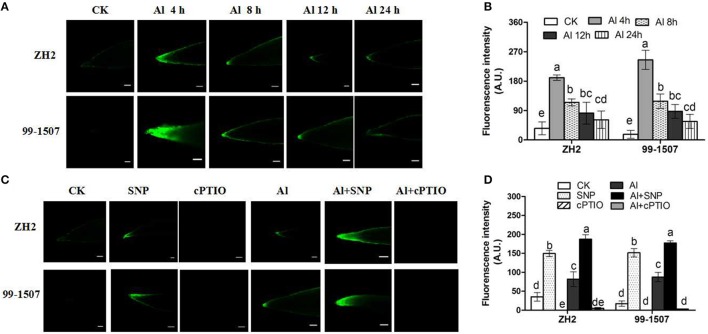
Figure 5.
Fluorescence detection of peanut root tips by DAF-FM diacetate staining and confocal microscopy. Scale bars = 100 μm. Fluorescence intensity was expressed as arbitrary units (A.U.) using Image J software (Rawak Software Inc., Germany). (A) Fluorescence detection of ZH2 and 99–1507 under different Al treatments times. (B) Fluorescence intensity of ZH2 and 99–1507 under different Al treatments. (C) Fluorescence detection of ZH2 and 99–1507 by addition of SNP and cPTIO. (D) Fluorescence intensity of ZH2 and 99–1507 by addition of SNP and cPTIO. Values represent means ± SD (n = 3). Different letters indicate significant differences at P < 0.05.

