
Figure 2.
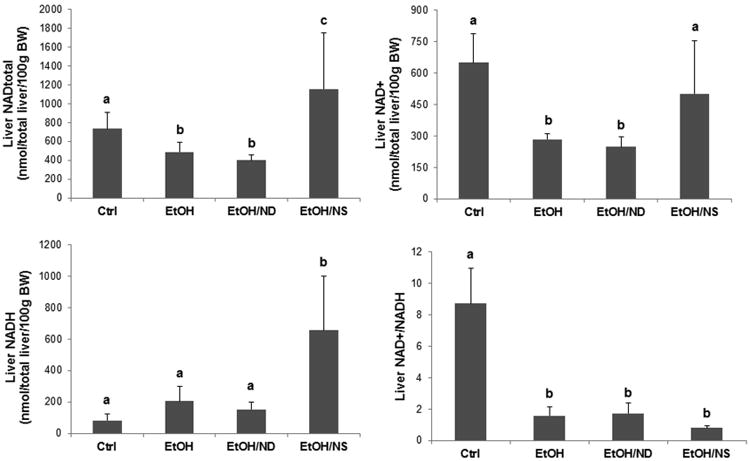
Hepatic NAD levels in rats after 8 weeks of liquid diet feeding. Liver total NAD, NAD+, and NADH concentrations as well as the NAD+/NADH ratio in the Ctrl, EtOH, EtOH/ND, and EtOH/NS rats were measured. Data are expressed as the mean ± SD from 6-8 rats. Means without a common letter differ at p < 0.05. BW, body weight; Ctrl, control group; EtOH, ethanol group; EtOH/ND, ethanol with dietary nicotinic acid deficiency group; EtOH/NS, ethanol with dietary nicotinic acid supplementation group.