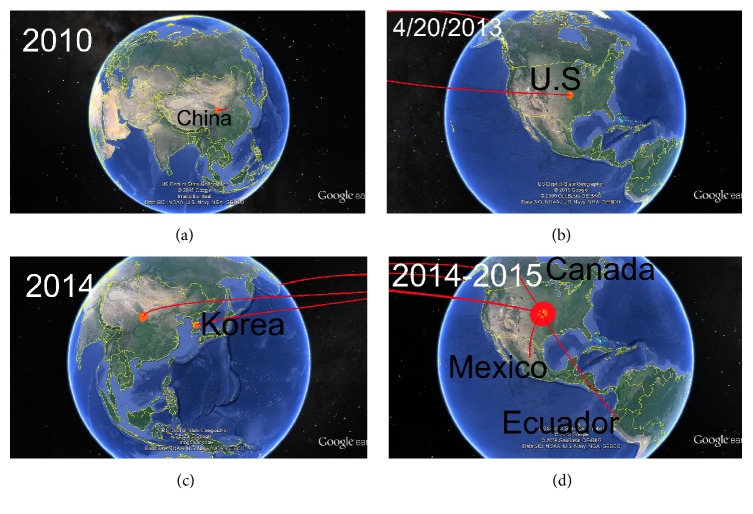
Figure 3.
Temporal dynamics of spatial PEDV diffusion. Temporal distribution of PEDV; only rates supported by a BF of >5 were considered significant. The map was directly taken from the output file of the spread software and visualized using Google Earth (whole video included as Video S1). The emergence of the PDEV strains in China is represented in panel (a), the arrival to US in 2013 is shown in panel (b), and the posterior distribution of the PEDV strains-like US is represented in panels (c) and (d).

