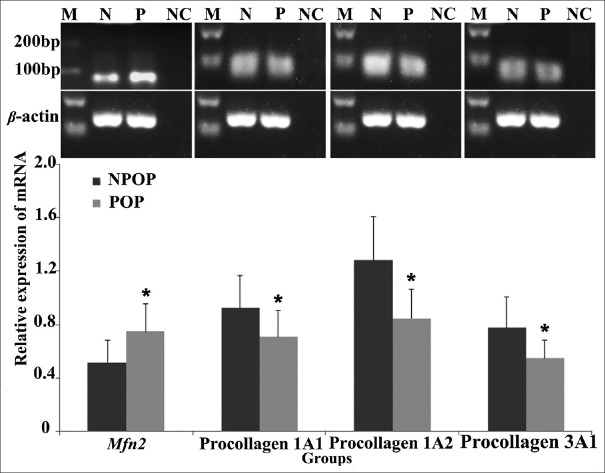
Figure 4.
mRNA expression levels of Mfn2 and procollagen in the POP and NPOP fibroblasts. Compared to the NPOP, the mRNA levels of Mfn2 in POP fibroblasts were upregulated, while mRNA levels of procollagen were downregulated. tMfn2(P:N) = 2.425, t1A1(P:N) = −2.165, t1A2(P:N) = −2.741, t3A1(P:N) = −2.147, respectively; PMfn2(P:N) = 0.032, P1A1(P:N) = 0.041, P1A2(P:N) = 0.026, P3A1(P:N) = 0.045, respectively. The significance was presented as *P < 0.05. M: Marker; N(NPOP): Non-pelvic organ prolapse; P(POP): Pelvic organ prolapse; NC: Negative Control; Mfn2: Mitofusin 2.

