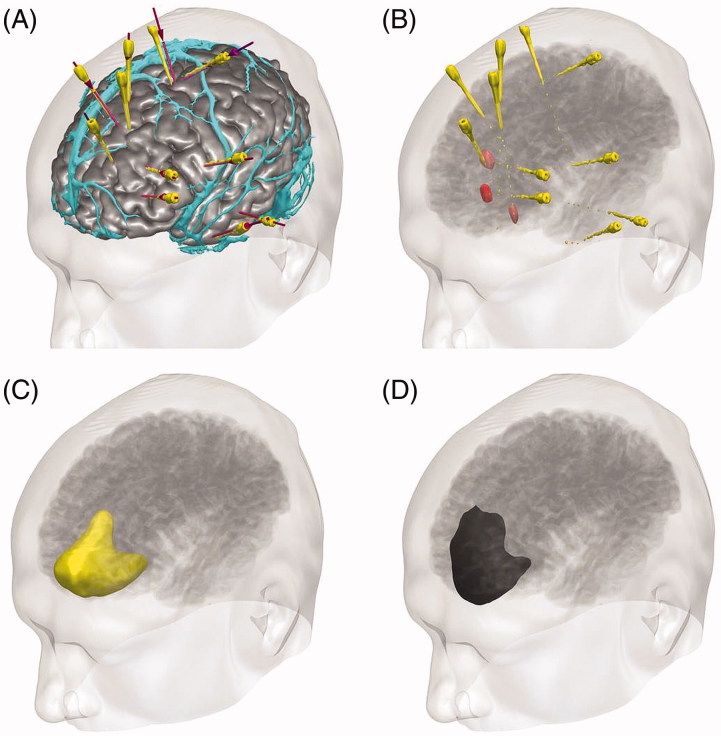
Figure 1.
EpiNavTM 3D display of SEEG and resection planning. (A) Cortex model (grey) with overlying veins (cyan), SEEG planned trajectories (violet) and implemented electrodes (yellow). (B) Electrode contacts involved in seizure onset (red) and seizure propagation (pink). (C) Planned resection model incorporating areas of interest (yellow). (D) Completed resection following surgery (black) (see online version for colour figures).

