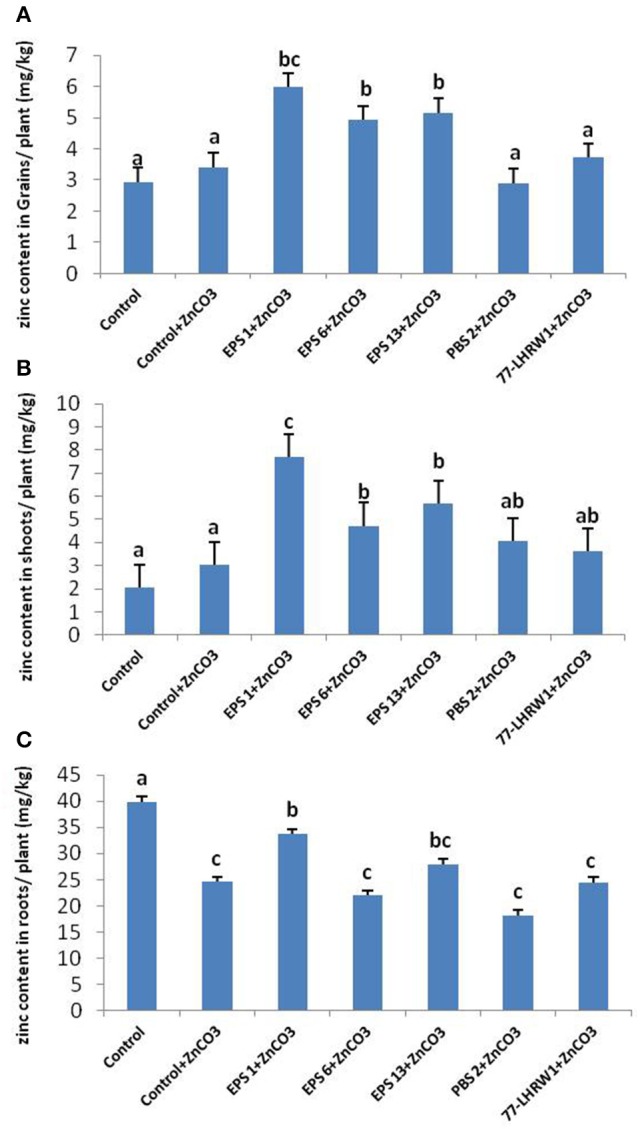
Figure 5.

Quantification of Zinc content in (A) Grains, (B) Shoots, and (C) Roots of inoculated and un-inoculated plants. Alphabets (a–c) represent the significant and non-significant difference among datasets. aIndicates no significant difference among dataset labeled with a on them. bShows a slight difference from (a) and same group category for dataset labeled with (b). cShows significant difference from a and b datasets and same data group labeled with c.
