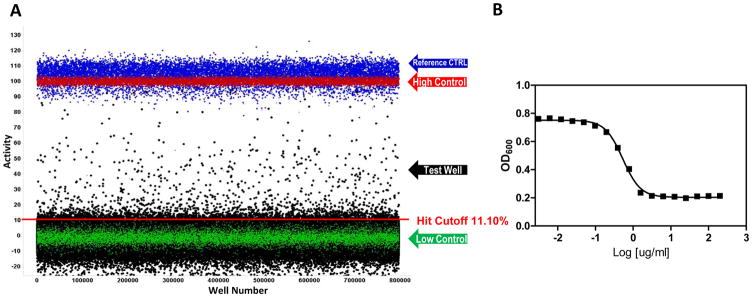
Figure 2.
AmpG primary HTS scattergram of 646,275 compounds screened in singlicate at ~18.2 μM; Test wells (black dots), reference control (blue dots), and control wells as described in the text (red and green dots). Data are shown normalized to percent max response of the high control. The hit cutoff is shown as the red line at 11.10%. (B) Example MIC of the control antibiotic Ciprofloxacin as tested during HTS graphed as OD600 vs log ug/mL of Ciprofloxacin. The average MIC is equal to 2.42± 0.79ug/mL; N = 15 plates with 16 replicates/dilution.

