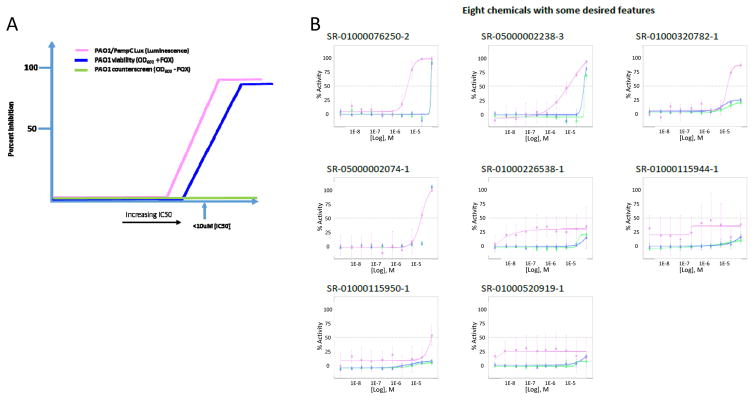
Figure 3.
Theoretical AmpG CRC assay graphical representation of desired compound activity index. The ideal compound would inhibit AmpG activity in the PAO1/PampC-Lux assay (pink line) to a greater extent than the PAO1 viability assay (blue line) and have no activity in the no Cefoxitin counterscreen (green line) ultimately bearing a selectivity index of at least >10 fold. FOX=Cefoxitin (B) Examples of the concentration response curves for the 8 molecules initially of interest following the HTS. The color legend for each of the assays is per part A. Points on each curve are derived from an N=3 with error bars shown. The SR# can be matched to the structure in Table 3 and also to activity in the supplement.

