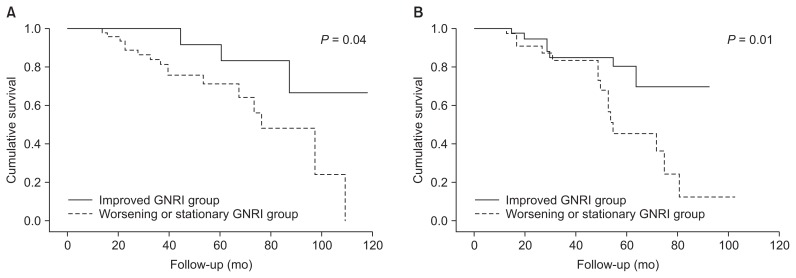
Figure 3. Kaplan-Meier analysis of GNRI change groups for MACCE according to baseline GNRI group.
The worsening or stationary GNRI group had higher risk of MACCE compared to the improved group in both (A) lower and (B) higher baseline GNRI groups (log-rank test, P = 0.04 and 0.01, respectively).
GNRI, geriatric nutritional risk index; MACCE, major adverse cardiac and cerebrovascular event.

