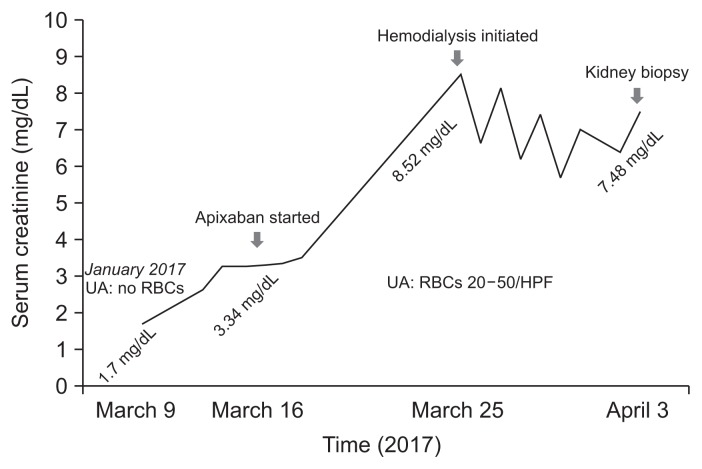
Figure 1. Serum creatinine changes in association with apixaban treatment.
Changes in serum creatinine level are shown by a solid line. Initiation of treatment with apixaban and kidney biopsy time are depicted by arrows. Hematuria prior and after apixaban therapy is shown as urinalysis (UA). Specific dates are depicted on the X axis, and the corresponding serum creatinine levels are shown above.
HPF, high power field; RBC, red blood cell.

