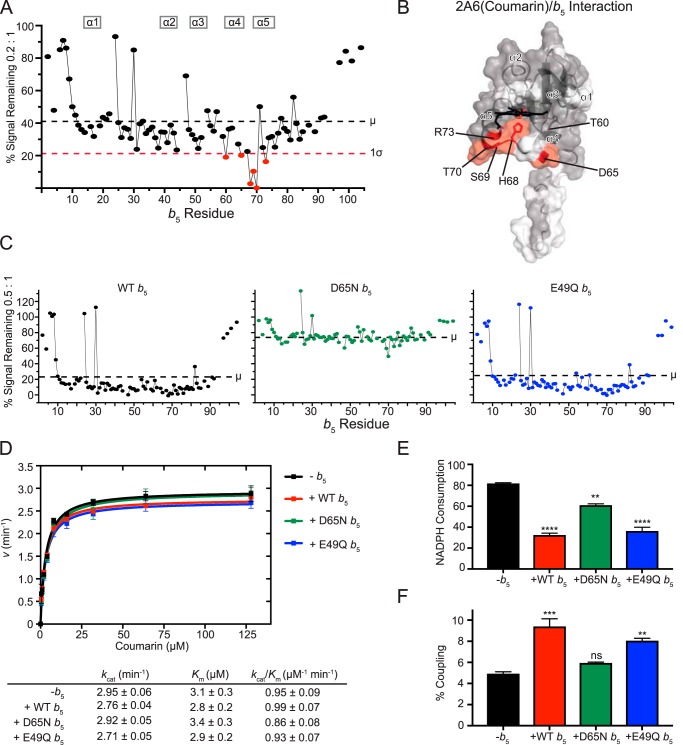
Figure 2.
Interaction of CYP2A6(coumarin) with [15N]b5 by NMR and b5 modulation of CYP2A6 catalysis. A, a single NMR spectrum of 0.2:1 CYP2A6(coumarin):[15N]b5 is shown graphically. The intensity of each b5 resonance (circle) corresponding to an individual b5 residue (x axis) is plotted as a percentage of that resonance's intensity in the absence of P450 (y axis). Fine lines between circles indicate continuous assignments for sequential b5 amino acids. Gaps in the line between circles indicate that one or more intervening b5 amino acids have not been assigned to an individual resonance in the spectrum (also shown in white in B). The average (μ) and average minus one S.D. (1σ) are indicated on the plot by black and red dashed lines, respectively, and constitute the selection criteria of b5 residues involved in P450 binding (red circles). B, on the surface of the human soluble domain b5 structure (PDB entry 2I96), residues displaying differential broadening effects are colored red, whereas residues that have assigned NMR resonances that are not differentially affected by P450 addition are colored gray, and unassigned residues are colored white. C, resonance intensity plots as in A, but comparing the effects of line broadening between WT b5 and b5 mutants D65N and E49Q at a fixed 0.5:1 CYP2A6(coumarin):[15N]b5 ratio. D, effects of wild-type and mutant b5 proteins on Michaelis–Menten kinetic parameters of CYP2A6-mediated coumarin 7-hydroxylation. Each sample was generated in duplicate with S.D. illustrated by error bars. Steady-state kinetic constants below are shown with S.D. E, measurement of NADPH consumed (nmol of NADPH/min/nmol of CYP2A6) for the CYP2A6 coumarin reaction at a fixed coumarin concentration of 128 μm. Samples were generated in duplicate with the S.D. illustrated by error bars. F, percent coupling of CYP2A6-mediated coumarin 7-hydroxylation of coumarin. Samples were generated in duplicate with the S.D. illustrated by error bars. ns, p >0.05; **, p ≤ 0.01; ***, p ≤ 0.001; ****, p ≤ 0.0001.

