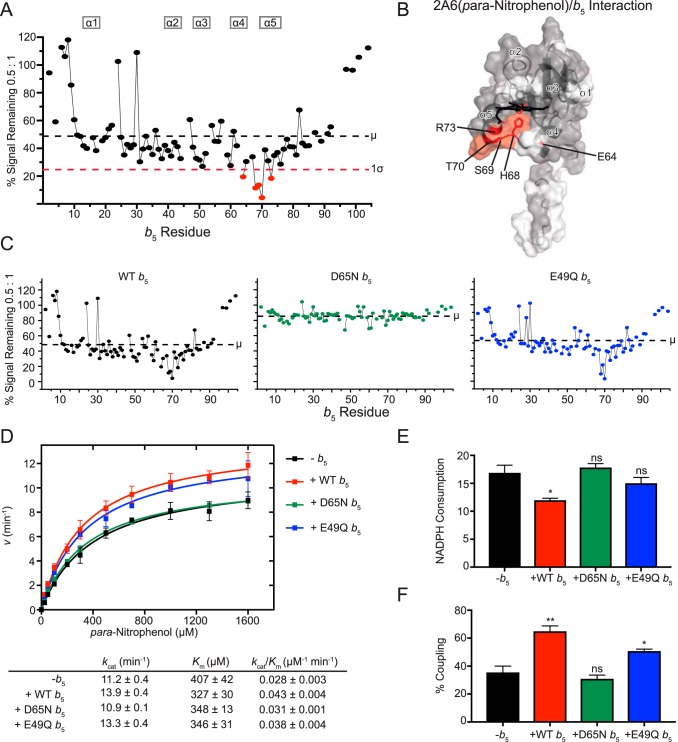
Figure 6.
Interaction of CYP2A6(pNP) with [15N]b5 as determined by NMR and catalytic modulation of b5 on CYP2A6 mediated metabolism of para-nitrophenol. A, b5 resonance intensity plot at a 0.5:1 (CYP2A6(pNP):[15N]b5) ratio normalized to the free b5 resonance intensity. The color code is as described in the legend to Fig. 2B. B, human soluble domain b5 structure (PDB entry 2I96) with residues displaying differential broadening effects colored red, residues that are assigned in the NMR spectrum colored gray, and unassigned residues colored white. C, b5 resonance intensity plots comparing the effects of line broadening between WT b5 and b5 mutants D65N and E49Q at a fixed 0.5:1 (CYP2A6(pNP):[15N]b5) ratio. D, effect of WT b5 and mutants on Michaelis–Menten kinetic parameters of CYP2A6-mediated 2-hydroxylation of pNP. Each sample was generated in duplicate with S.D. illustrated by error bars. Steady-state kinetic constants below are shown with S.D. E, measurement of NADPH consumed (nmol of NADPH/min/nmol of CYP2A6) for CYP2A6 pNP reaction at a fixed pNP concentration of 1.6 mm. Samples were generated in duplicate with the S.D. illustrated by error bars. F, percent coupling of CYP2A6-mediated 2-hydroxylation of pNP. Samples were generated in duplicate with the S.D. illustrated by error bars. ns, p > 0.05; *, p ≤ 0.05; **, p ≤ 0.01.

