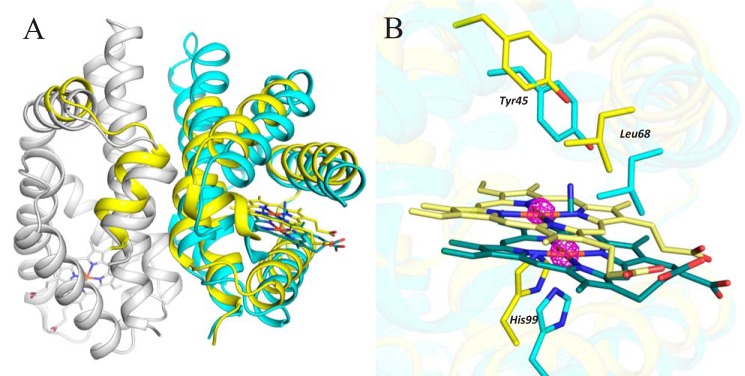
Figure 3.
Structural changes induced by sodium dithionite soaking (PDB code 5OHF). A, chains G and H are shown using a secondary structure representation (in cyan and gray, respectively) except for their heme and CN− moieties, which are shown using a stick representation (colored in dark cyan for chain G and dark gray for chain H). Alternative B is shown in yellow, and the position of its heme group is shown in light yellow using a stick representation. Most of the residues adopting different positions in alternative B are in chain G. B, detailed view of the shift of the heme group and the surrounding heme pocket upon dithionite soaking. The active Fe(III)-CN− form is shown in cyan, and the inactive Fe(II) form is shown in yellow. The anomalous difference map (magenta, contoured at 5σ) confirms the presence of iron in two positions (observed in chain G only). The graphics were generated using PyMOL (Schrödinger, LLC).

