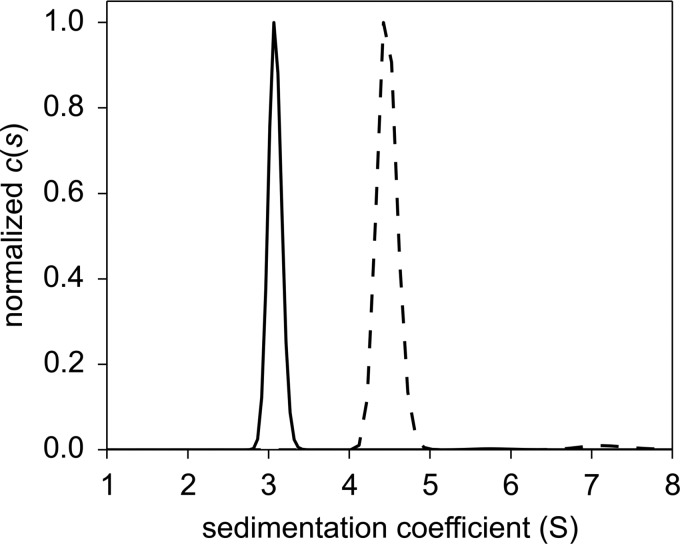
Figure 4.
Sedimentation coefficient distributions for the isolated globin domain of AfGcHK (15 μm; black solid line) and the full-length AfGcHK (15 μm; black dashed line). The weight average sedimentation coefficients were calculated from the absorbance data. For further details, see “Experimental procedures.” c(s) denotes the continuous sedimentation coefficient distribution.

