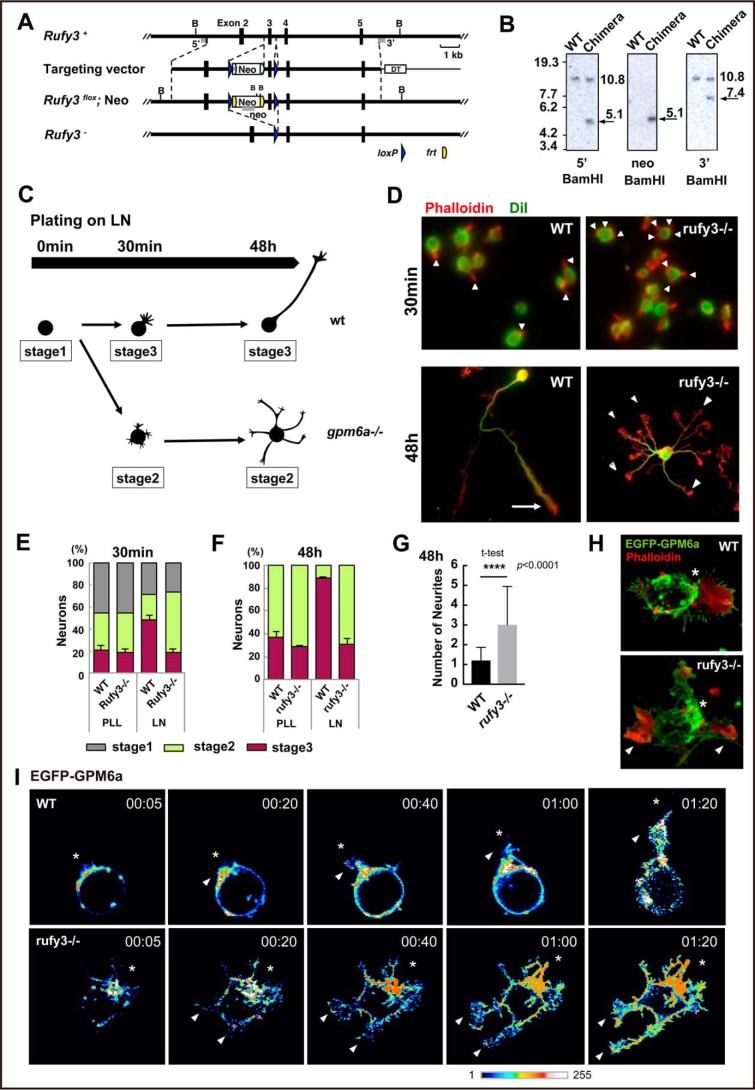
Figure 1.
Generation of Rufy3-KO mice and abnormalities in the polarity of their neurons. A, strategy for conditional inactivation of the mouse Rufy3 gene. B, BamHI site; Neo, neomycin resistance gene; DT, diphtheria toxin gene. B, Southern blot analysis of genomic DNA isolated from WT ES cells and chimeric clones. The DNA was digested with BamHI and hybridized with 5′ and 3′ probes. Each band was detected at the expected size. C, schematic models of the time course in neuronal polarity determination of the cultured neurons plated on LN. The schematics show the representative neuronal shapes at each time point. Developmental stages of the neurons were morphologically defined according to the definition of Dotti et al. (19); i.e. stage 1, cells with no neurite (gray); stage 2, multipolar cells (green); and stage 3, polarized cells (pink). In the WT, the neurons dramatically changed from stage 1 to 3 within 1–4 h after plating on LN. In contrast, the gpm6a−/− neurons still remained at stages 1 to 2 at the same time course (see Ref. 9). D–G, cortical neurons derived from WT or rufy3−/− mice were cultured for 30 min or 48 h on LN. D, the plasma membrane (green) and F-actin (red) were stained using DiI and phalloidin, respectively. Scale bars, 50 (upper) and 20 μm (lower). E and F, percentage of neurons at stage 1, 2, or 3 from WT or rufy3−/− mice plated for 30 min (E) or 48 h (F) on LN (see also Ref. 9) (one-way analysis of variance with Tukey's multiple comparisons test; n 500 cells (E) and n 300 cells (F) for each group; error bars represent S.D. of the percentage of the stage 3 neurons in each group). G, the numbers of neurites of WT or rufy3−/− mice after 48-h culture (two-tailed t test (means ± S.D.); WT (1.203 ± 0.661) versus rufy3−/− (3.00 ± 1.944); ****, p < 0.0001; n = 300 from five distinct preparations; error bars represent S.D.). H, in LN-dependent cultures, growth cones (arrowheads) protruded from a GPM6a (green)-enriched membrane area (asterisk) in the cortical neurons from WT but not from rufy3−/− mice. Scale bar, 20 μm. I, time-lapse imaging of EGFP-GPM6a overexpressed in the cortical neurons of WT and rufy3−/− mice for 80 min after plating on LN. The fluorescence intensities of EGFP-GPM6a are shown as pseudocolor images. Neurites (arrowheads) protruded from the GPM6a-enriched membrane area (asterisk) in WT but not in rufy3−/−. Scale bar, 20 μm. PLL, poly-l-lysine.

