Figure 5.
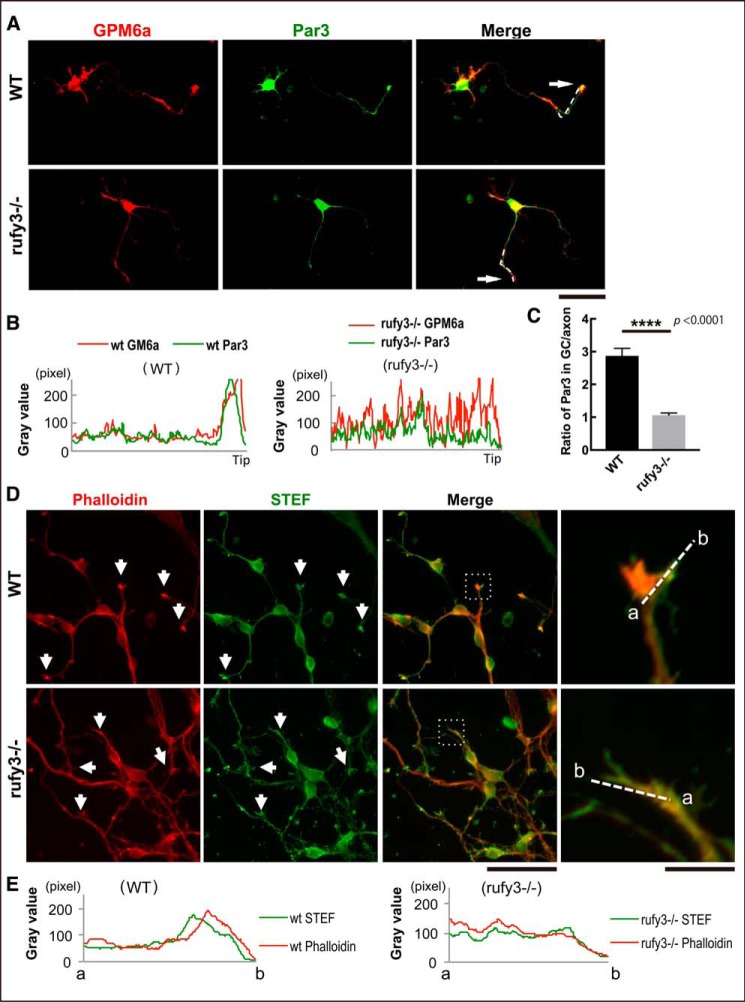
Loss of Rufy3 disturbs the accumulation of neuronal polarity determinants in the growth cone. A, immunofluorescence staining of GPM6a (red) and Par3 (green) in WT and rufy3−/− cortical neurons (48 h after plating on LN). Arrows, growth cones. Scale bar, 50 μm. B, immunofluorescence intensity plot profiles of anti-GPM6a (red) and anti-Rufy3 (green) from the axon shaft to the growth cone (tip) are shown as dotted lines in A. C, ratio of the immunofluorescence intensity of Par3 in the growth cone versus that of the axon (two-tailed t test (means ± S.E.); WT (2.87 ± 0.23) versus rufy3−/− (1.06 ± 0.07); ****, p < 0.0001; n = 25; error bars represent S.E.). D, immunofluorescence staining of phalloidin (red) and anti-STEF antibody (green) in WT and rufy3−/− cortical neurons (48 h after plating on LN). High magnification images of insets are shown in the left panels. Arrows, growth cones. Scale bars, 100 (left) and 20 μm (right). E, detailed fluorescence plot profiles of each fluorescence image along the a–b lines in D are shown.

