Figure 3.
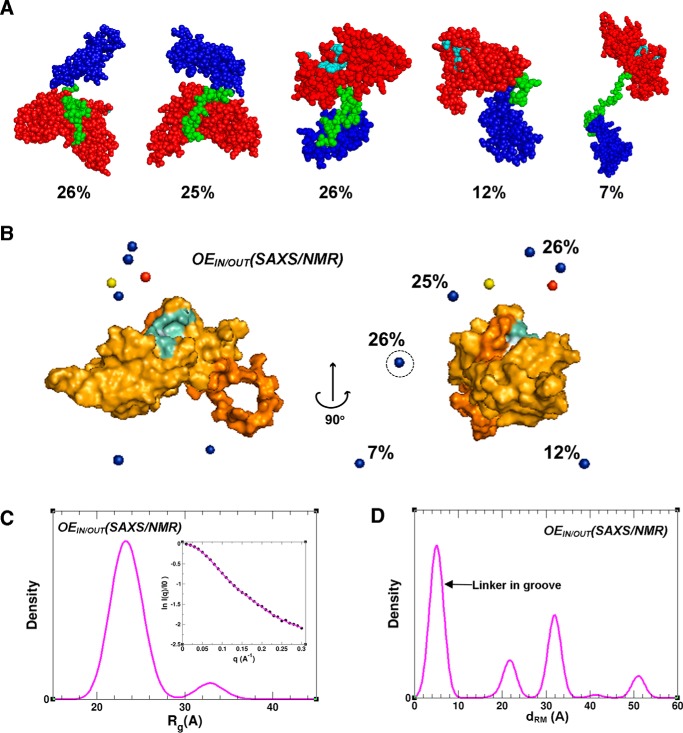
Dynamic ensemble of the TTD–PHD reader in solution derived from SAXS and NMR data. A, the most populated (based on weighted %) conformers from OEIN/OUT(SAXS/NMR). The TTD, PHD, and linker are colored in red, blue, and green, respectively. TTD residues that form the aromatic cage are displayed in cyan. B, the position of PHD centers of mass in the most populated conformers from OEIN/OUT(SAXS/NMR) (blue spheres) superimposed with the TTD (as a surface representation). Residues that bind to the H3 peptide are displayed in cyan. The red sphere shows the PHD center of mass in H3-bound UHRF1 TTD–PHD (PDB code 3ASK) (10), and the yellow sphere shows the PHD center of mass in apo TTD–PHD of UHRF2 (PDB code 4TVR). The average populations (%) are displayed. (See also supplemental Fig. S3 for comparison.) C, Rg distribution in OEIN/OUT(SAXS/NMR). The inset shows the experimental SAXS profile plotted with the theoretical profile averaged over the ensemble. D, the distribution of Cα-Cα distance between residues Arg296 and Met224 (i.e. dRM; refer to Fig. 1C diagram) in OEIN/OUT(SAXS/NMR).

