Figure 1.
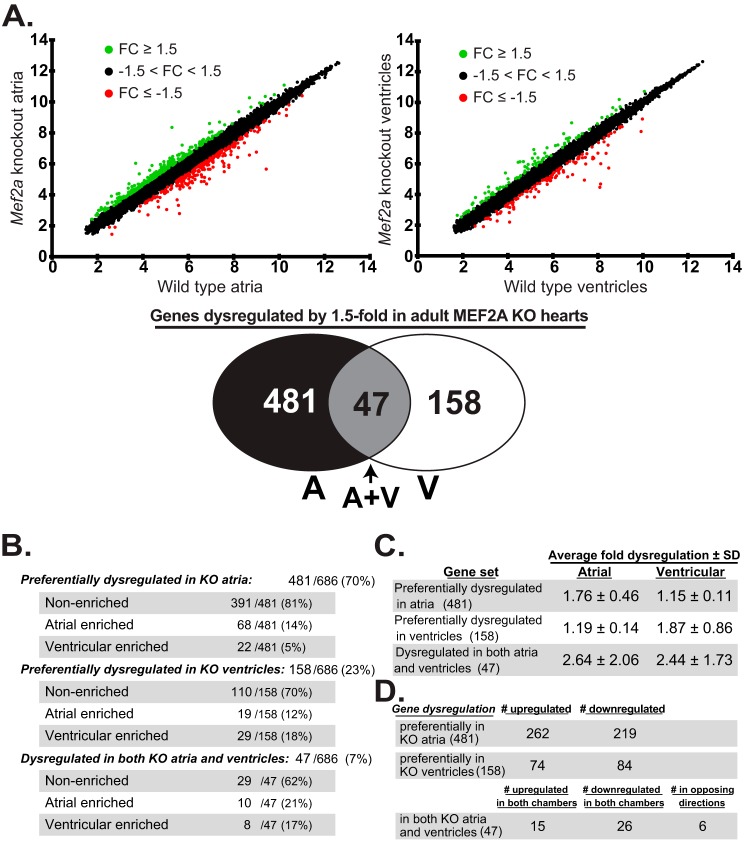
MEF2A regulates overlapping but distinct genes in the atria and ventricles of the adult heart. A, top, scatter plots depicting gene expression differences in MEF2A KO atria and ventricles. Wild-type (WT) and MEF2A KO atria microarray intensities (top left graph) and WT and MEF2A KO ventricle microarray intensities (top right graph) were plotted against one another. n each graph, genes up-regulated by at least 1.5-fold are plotted in green (FC ≥ 1.5); genes down-regulated by at least −1.5-fold are plotted in red (FC ≥ −1.5); and genes dysregulated by no greater than 1.5-fold in either direction are plotted in black (−1.5 < FC < 1.5), where FC is fold-change. Of the 21,212 gene probe sets on the Mouse Affymetrix GeneChip® gene 1.0 ST array system, 686 well-annotated genes were dysregulated by at least 1.5-fold or greater in adult Mef2a KO hearts. Bottom, Venn diagram summarizes dysregulated gene expression profile in KO atria (A), KO ventricles (V), and both (A+V). B, of the total 686 dysregulated genes, 481 genes (70%) were preferentially dysregulated in KO atria; 158 genes (23%) were preferentially dysregulated in KO ventricles, and the remaining 47 genes (7%) were dysregulated in both KO cardiac chambers. These genes were further categorized based on their chamber expression profile (chamber enrichment is specified as 2.0-fold or greater expression in one chamber relative to the other) in WT hearts. Most of the preferentially dysregulated genes are similarly expressed in both atria and ventricles of WT hearts. C, average fold dysregulation of each three gene sets. Averages are calculated as absolute values. D, analysis of direction of dysregulation in each gene set. Similar number of genes were up- and down-regulated in each. 6 out of the 47 genes dysregulated in both KO atria and ventricles are up- and down-regulated in different chamber types.

