Figure 6.
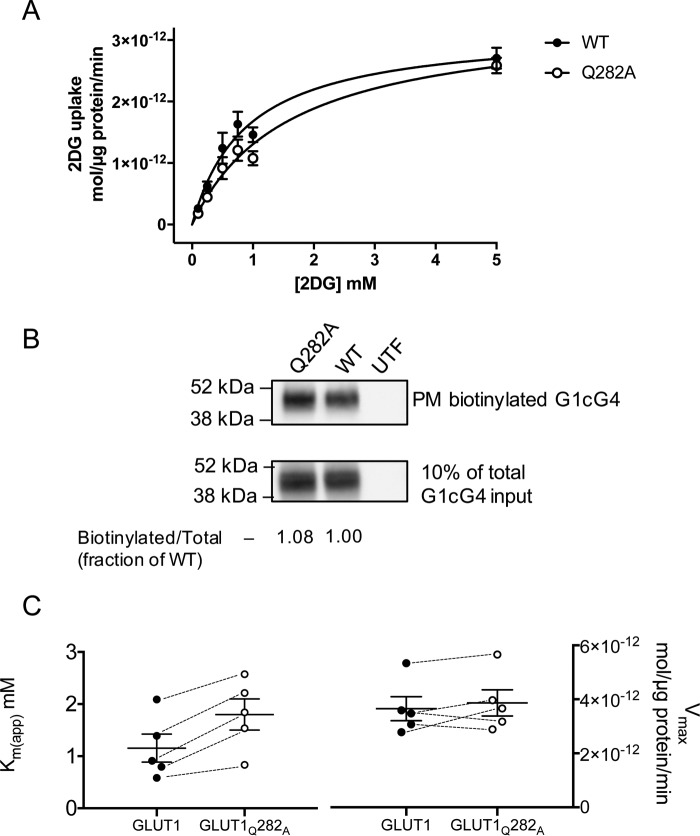
Sugar transport in HEK293 cells heterologously expressing wtGLUT1 or GLUT1Q282A. A, Michaelis–Menten kinetics of zero-trans 2DG uptake in cells expressing wtGLUT1 (○) or GLUT1Q282A (●). 2DG uptake in μmol/μg cell protein/min is plotted versus [2DG] in mm. Each data point is the mean ± S.E. of three or more duplicate measurements and is corrected for 2DG uptake in mock-transfected cells. The curves were computed by nonlinear regression assuming Michaelis–Menten uptake kinetics (Equation 1) and have the following constants: wtGLUT1 (●): Vmax = 3.2 ± 0.02 pmol/μg protein/min, Km(app) = 0.89 ± 0.18 mm, R2 = 0.884, standard error of regression = 0.31 pmol/μg protein/min; GLUT1Q282A (○): Vmax = 3.4 ± 0.3 pmol/μg protein/min, Km(app) = 1.59 ± 0.28 mm, R2 = 0.926, standard error of regression = 0.24 pmol/μg protein/min. B, cell surface expression of wtGLUT1 and GLUT1Q282A in HEK293 cells. The mobility of molecular weight markers is indicated at the left of the blot which shows GLUT1 levels present in biotinylated membrane proteins collected from untransfected (UTF), wtGLUT1-expressing (WT), and GLUT1Q282A-expressing (Q282A) HEK293 cells. C, Km(app) but not Vmax for 2DG transport is affected in GLUT1Q282A. The results of five separate experiments are shown as scatter-dot plots for both Km(app) and Vmax. The results are shown as means ± S.E. Paired t test analysis (dashed lines indicate paired measurements) indicates that Vmax is not significantly affected by the Q282A mutation (p = 0.2036) but that Km(app) increases 2-fold (p = 0.0046).

