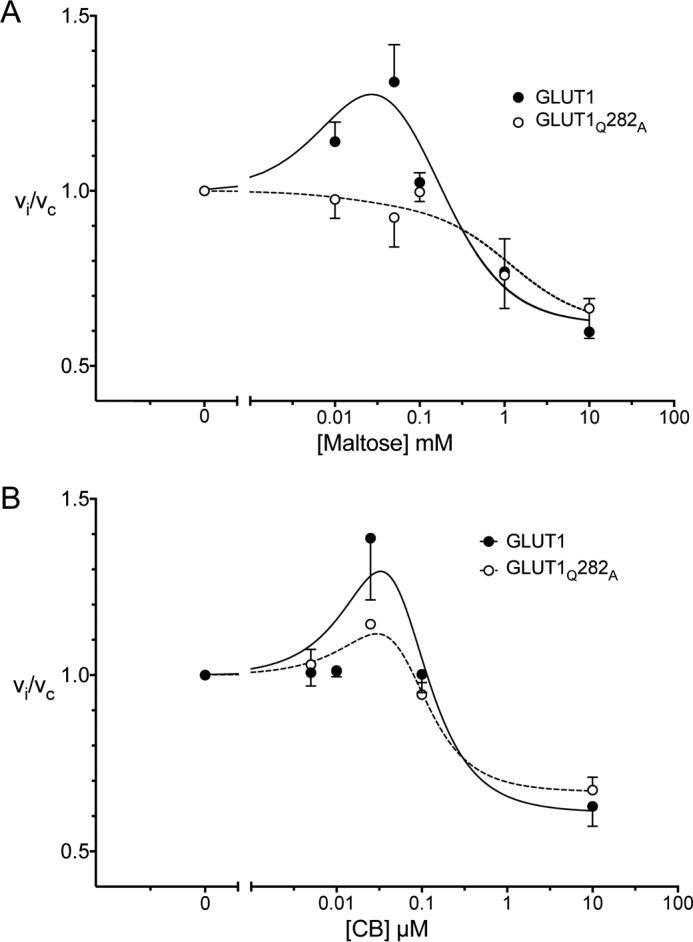
Figure 7.

cis- and trans-Allostery in wtGLUT1 (●) and GLUT1Q282A (○). A, cis-allostery. Concentration dependence of maltose modulation of 2DG influx is shown. Normalized 2DG uptake (vi/vc) is plotted as a function of [maltose] (mm) on a log scale. The curves drawn through the points (solid lines for wtGLUT1 (●) and dashed lines for GLUT1Q282A (○)) were computed by nonlinear regression using Equation 2 and have the following constants: wtGLUT1 (●), K1 = 0.0028, K2 = 0.31 mm−1, K3 = 0.197 mm−1, K4 = 1.62 mm−2, R2 = 0.582, standard error of regression = 0.147; GLUT1Q282A (○), K1 = 0.028, K2 = 1.83 mm−1, K3 = 1.911 mm−1, K4 = 1.62 mm−2, R2 = 0.582, standard error of regression = 0.147. B, trans-allostery. Concentration dependence of CB modulation of 2DG influx is shown. Normalized 2DG uptake (vi/vc) is plotted as a function of [CB] (μm) on a log scale. The curves drawn through the points (solid lines for wtGLUT1 (●) and dashed lines for GLUT1Q282A (○)) were computed by nonlinear regression using Equation 2 and have the following constants: wtGLUT1 (●), K1 = 0.0041 μm2, K2 = 0.073 μm, K3 = 2 × 10⁻¹² μm, K4 = 1.64, R2 = 0.637, standard error of regression = 0.179; GLUT1Q282A (○), K1 = 0.0050 μm2, K2 = 0.039 μm, K3 = 8.3 × 10⁻¹⁴ μm, K4 = 1.495, R2 = 0.849, standard error of regression = 0.067.
