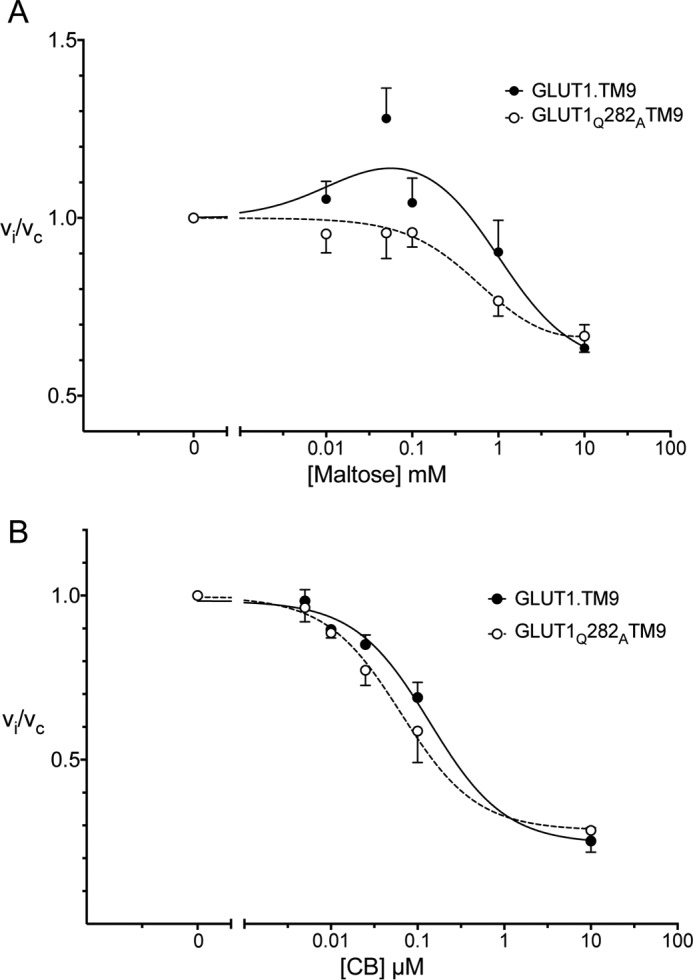
Figure 8.

cis- and trans-Allostery in a GLUT1 oligomerization-deficient background. GLUT1(GLUT3-H9) and GLUT1(GLUT3-H9)Q282A expressed in HEK293 cells were tested for their ability to mediate cis- and trans-allostery. A, cis-allostery. Concentration dependence of maltose modulation of 2DG influx. Normalized 2DG uptake (vi/vc) is plotted versus [maltose] (mm) on a log scale. The curves drawn through the points (solid lines for GLUT1(GLUT3-H9) and dashed lines for GLUT1(GLUT3-H9)Q282A) were computed by nonlinear regression using Equation 2 and have the following constants: GLUT1(GLUT3-H9) (●), K1 = 0.0022, K2 = 2.052 mm−1, K3 = 1.707 mm−1, K4 = 1.72 mm−2, R2 = 0.656, standard error of regression = 0.137; GLUT1(GLUT3-H9)Q282A (○), K1 = 0.081, K2 = 0.63 mm−1, K3 = 0.626 mm−1, K4 = 1.528 mm−2, R2 = 0.747, standard error of regression = 0.080. B, trans-allostery. Concentration dependence of CB modulation of 2DG influx. Normalized 2DG uptake (vi/vc) is plotted versus [CB] (μm) on a log scale. The curves drawn through the points (solid lines for GLUT1(GLUT3-H9) and dashed lines for GLUT1(GLUT3-H9)Q282A) were computed by nonlinear regression using Equation 3 and have the following constants: GLUT1(GLUT3-H9) (●), K1 = 0.984 μm/s, K2 = 0.740 μm/s, K3 = 0.138 μm, R2 = 0.963, standard error of regression = 0.058; GLUT1(GLUT3-H9)Q282A (○), K1 = 0.996 μm/s, K2 = 0.711 μm/s, K3 = 0.065 μm, R2 = 0.904, standard error of regression = 0.093.
