
Figure 3.
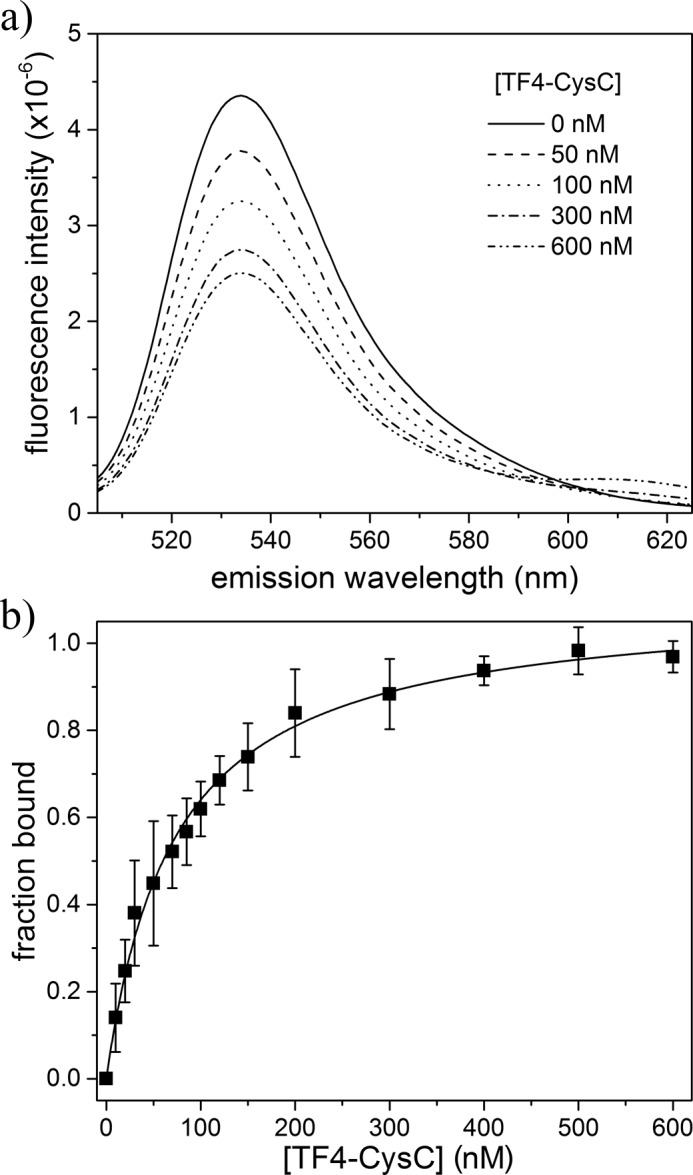
HF488-Aβ/TF4-CysC binding interaction by FRET analysis. a, mixture fluorescence was measured as a function of TF4-CysC, holding HF488-Aβ constant at 400 nm (excitation 488 nm). Average of three independent scans is shown for a representative set of mixtures. b, donor emission at 530 nm was used to calculate FRET efficiency and determine fraction of HF488-Aβ bound for each TF4-CysC concentration. Data points are the average of three independent trials. Error bars represent the sample standard deviation. Solid line is the Hill equation fit to the data, with n = 1.