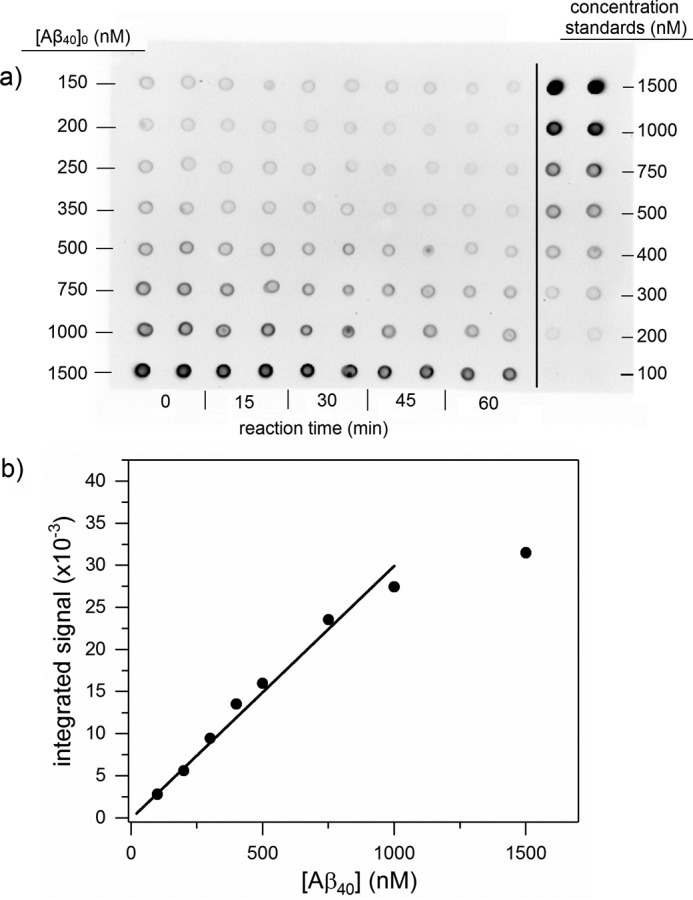
Figure 4.

Aβ40 degradation by CatB. a, sample immunoblot showing Aβ40 degradation by CatB. Mixtures of 200 nm CatB and the listed [Aβ40]0 were incubated at 37 °C and pH 7.4. Samples were dotted onto the membrane in duplicate at each time point shown. Concentration standards were also dotted in duplicate. b, concentration standard curves were used to convert integrated signal to Aβ concentration. Signals near saturation were discarded from analysis due to non-linearity. Data points are the average of two dots in the concentration standards shown in a.
