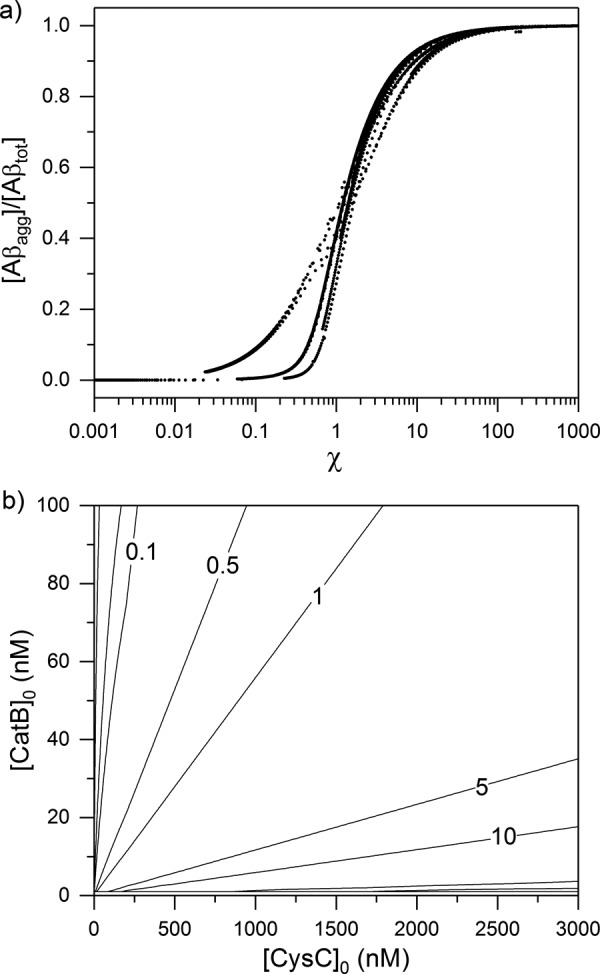
Figure 8.

a, interaction model was iterated over various initial concentrations of CysC (0–3000 nm), CatB (0–100 nm), and Aβ (20 or 100 nm, for both Aβ40 and Aβ42). On each iteration, χ was calculated, the model was solved to steady state, and the fraction of aggregated Aβ compared with the total initial Aβ was determined. Each point represents one complete model solution given a unique set of initial conditions. b, example set of calculated χ values for initial Aβ40 concentration of 10 nm is shown on a contour diagram. Lines of constant χ are shown.
