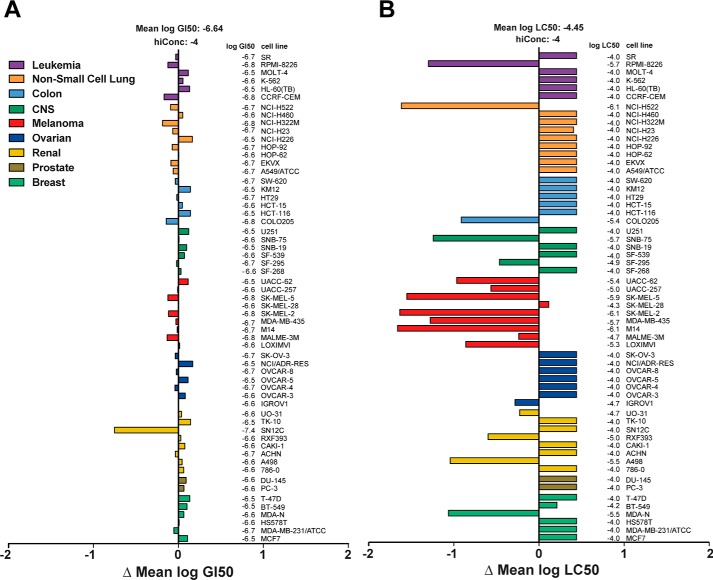
Figure 1.
Growth inhibition and lethality pattern of mensacarcin in the NCI-60 human tumor cell line screen. Presented are the mean graphs that show the difference in response to mensacarcin (NSC 718798) of the individual cell line to the mean response of all cell lines for the log GI50 (A) and the log LC50 (B). The NCI-60 screen data were retrieved from the publically available NCI Developmental Therapeutics Program database (https://dtp.cancer.gov/).5

