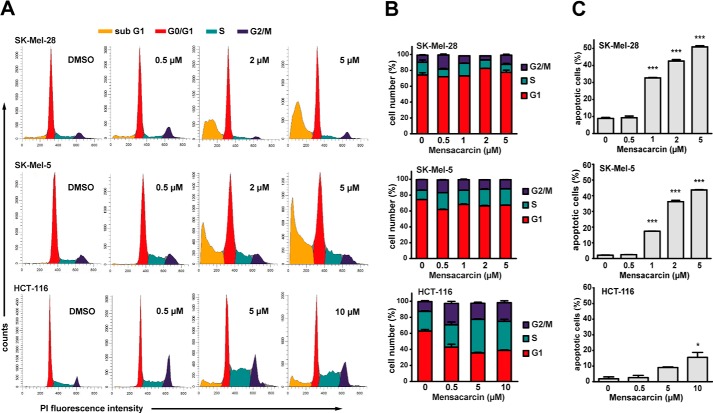
Figure 6.
Cell cycle analysis of mensacarcin-treated cells. A, cell cycle distribution was analyzed by flow cytometric measurements after PI staining. B and C, cell cycle analysis (B) and quantification of apoptotic cells (C) appearing in sub-G1 fraction upon mensacarcin treatment. SK-Mel-28, SK-Mel-5 cells, and HCT-116 were grown in the presence of various concentrations of mensacarcin or 0.5% (v/v) DMSO for 24 h. The apoptotic cell fraction was calculated by including and gating on the sub-G1 peak. Results are presented as mean ± S.D. (error bars) of duplicates (n = 2). *, p < 0.05; ***, p < 0.001 versus DMSO control.

