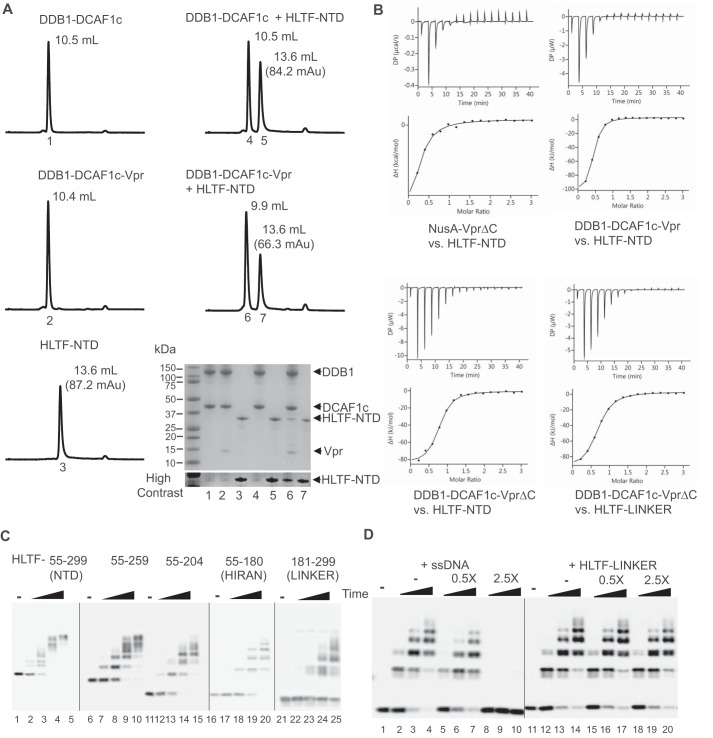
Figure 2.
Two separate N-terminal regions of HLTF are targeted by Vpr. A, DDB1-DCAF1c, DDB1-DCAF1c-Vpr, both at 12.5 μm, or HLTF-NTD at 62.5 μm was injected into an analytical Superdex200 Increase gel filtration column at a flow rate of 0.5 ml/min (left panels). Absorbance at UV 280 nm was recorded. Protein mixtures of DDB1-DCAF1c or DDB1-DCAF1c-Vpr, with HLTF-NTD were also analyzed (right panels). The peak elution volume (ml) is labeled in each panel. The peak absorbance for HLTF-NTD is also indicated. Elution peaks were collected, analyzed by SDS-PAGE, and visualized by Coomassie Brilliant Blue staining (bottom right panel). The number under each peak refers to the lane number in the SDS-PAGE analysis panel. B, isothermal titration trace for NusA-VprΔC binding to HLTF-NTD is shown (left top panel). A single-site binding isotherm curve fitting yielded a Kd of 5.8 ± 2.2 μm. Isothermal titration traces for HLTF-NTD binding to DDB1-DCAF1c-Vpr (right top panel) and DDB1-DCAF1c-VprΔC (left bottom panel) are also shown. The data were best fitted with a single-site binding isotherm yielding a Kd of 1.1 ± 0.2 μm and 1.3 ± 0.2 μm, respectively. Isothermal titration traces for HTLF-LINKER binding to DDB1-DCAF1c-VprΔC (right bottom panel) yielded a Kd of 2.1 ± 0.1 μm. C, in vitro ubiquitination assays of various truncation constructs of HLTF-NTD, including residues 55–259, 55–204, 55–180 (HIRAN), and 181–299 (LINKER), with CRL4-DCAF1c-Vpr E3 ligase. D, in vitro ubiquitination assays of HLTF-HIRAN with CRL4-DCAF1c-Vpr E3 ligase. The reaction mixtures contained increasing concentrations of single-stranded DNA (ssDNA) or HLTF-LINKER at molar ratios of 0-, 0.5-, and 2.5-fold over HLTF-HIRAN. The sequence of oligonucleotide used in the assay is 5′-AGCTACCATGCCTGCCTCAAGAATTCGTAA-3′. All experiments were repeated two to three times with similar results.

