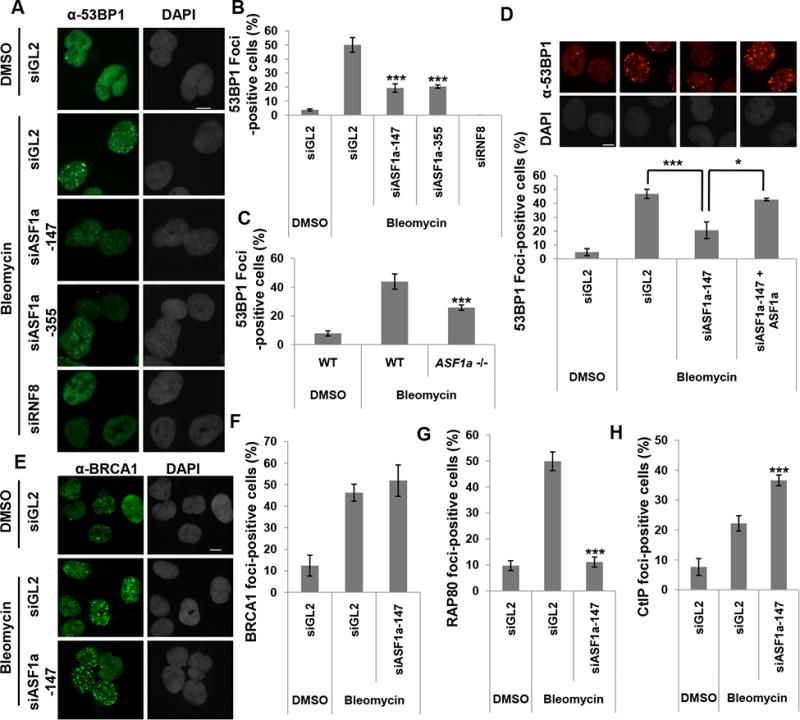
Figure 3. ASF1a is required for the recruitment of 53BP1 and RAP80 at DSBs.

(A to C) Decrease of 53BP1 foci upon depletion of ASF1a in U2OS cells or in ASF1a -/-cells after treatment with bleomycin for 1 hr before fixation. Representative images (A) and quantitation (B and C). Cells with >20 foci of 53BP1 were counted. Scale bar, 10 μm. Mean ± S.D. of triplicates. ***, P < 0.005. Scale bar, 10 μm. See also Figure S2. (D) Rescue of 53BP1 foci in ASF1a-depleted U2OS cells by siRNA-resistant ASF1a. Representative images (top) and Mean ± S.D. of triplicates. ***, P< 0.005; *, P< 0.05 (bottom). (E and F) No change of BRCA1 foci upon depletion of ASF1a. Representative images (E) and quantitation (F). (G) RAP80 foci are decreased in ASF1a depleted U2OS cells. (H) CtIP foci are increased in ASF1a depleted U2OS cells. The quantitations in (F-G) is the same as in (B), and cells having over 5 foci of CtIP were counted in (H).
