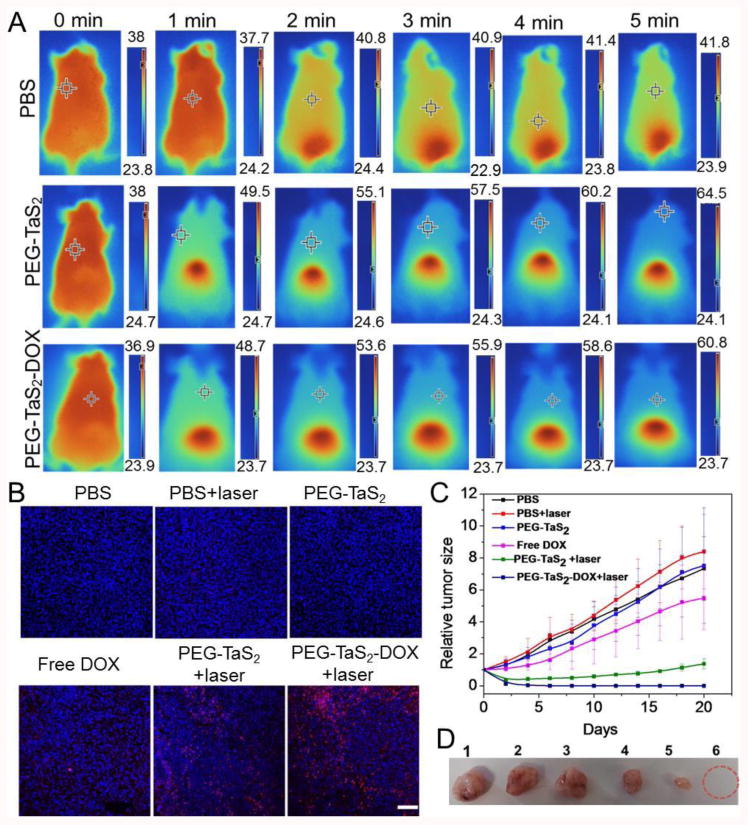
Figure 4.

(A) Thermal images of tumor-bearing mice after treatment with PBS, PEG-TaS2 NSs, and PEG-TaS2-DOX NSs followed by laser irradiation. Please note that the scale bar is different for each image. (B) TUNEL staining of tumor tissues (the scale bar is 100 μm) and (C) tumor growth curves of mice from different treatment groups. (D) Photograph of representative tumors from C. Form 1 to 6: PBS group, PBS+laser group, PEG-TaS2 group, free DOX group, PEG-TaS2+laser group, and PEG-TaS2-DOX+laser group.
