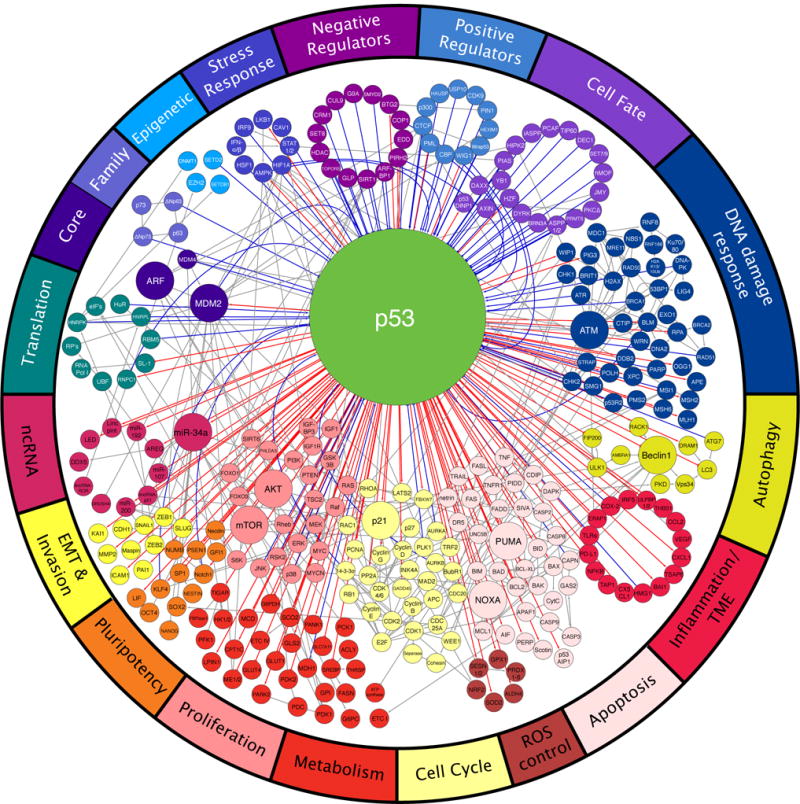
Figure 1. The p53 network.

A wide variety of regulators govern the activity of p53 (top), which, in turn, controls many distinct biological processes (bottom). Each node represents a gene and each line represents an interaction. Direct p53 inputs are indicated as blue lines and direct p53 outputs are indicated as red lines. Noticeably, p53 controls effector processes by activating multiple target genes. Downstream pathways are highly interconnected (gray lines). Interactions are annotated as positive (arrow), negative (T-bar), or modifying (solid circle).
