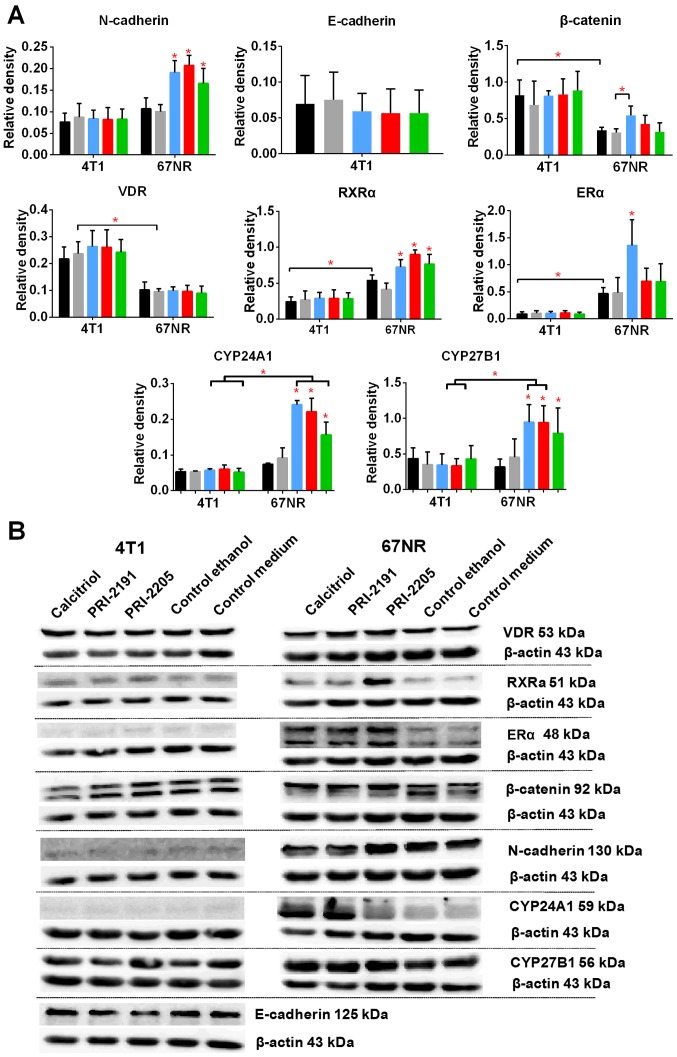
Figure 12.
Western blot analysis of the expression of selected proteins in 4T1 and 67NR cells cultured in vitro. (A) Western blot analysis of selected protein expression. (B) Representative blots. Color bars, black, control medium; gray, ethanol control; blue, calcitriol; red, PRI-2191; green, PRI-2205. Experiments were repeated thrice. Results are expressed as mean ± standard deviation of protein tested to actin ratio and representative cropped blots. Statistical analysis: Dunnett's multiple comparisons test. *P<0.05 as compared to both controls or as indicated.

