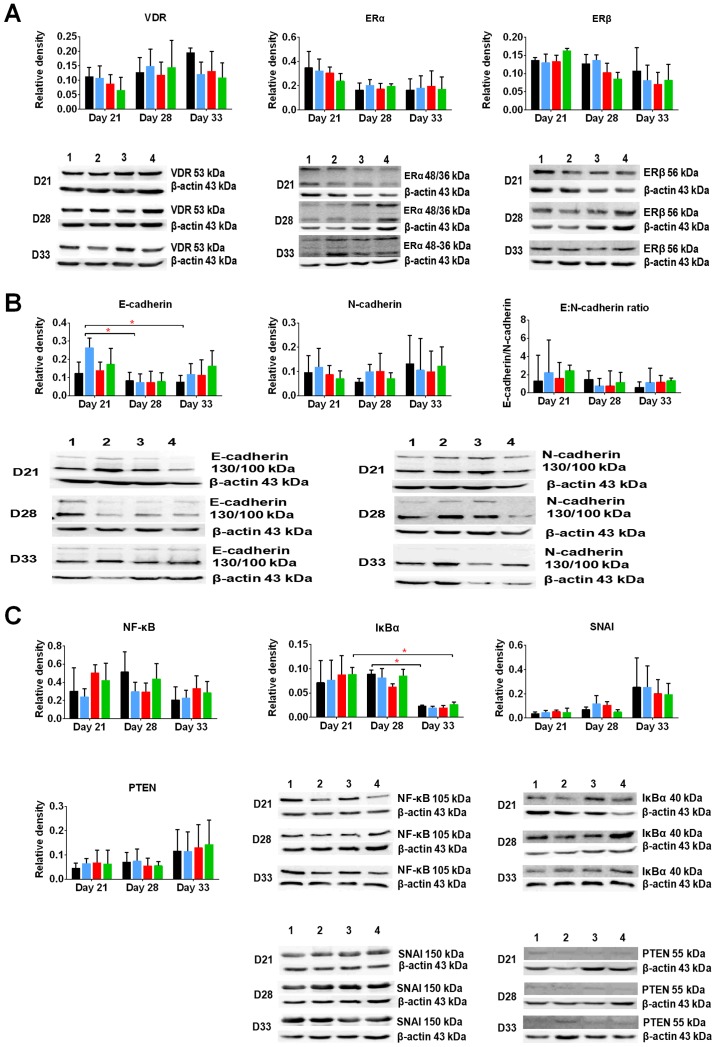
Figure 6.
Selected proteins in 4T1 tumor tissue from mice treated with calcitriol or its analogs. Western blot analysis of (A) nuclear receptors; (B) epithelial-mesenchymal transition markers; (C) transcription factors. Color bars, black, control animals; blue, calcitriol; red, PRI-2191; green, PRI-2205. Bands on the blot were determined as: 1, control animals; 2, calcitriol; 3, PRI-2191; 4, PRI-2205. Number of mice evaluated were 3–4 per group. Chemiluminescence was visualized using Image station 4000MM PRO (Carestream). Densitometry analysis of the western blots was performed using Carestream MI Software 5.0.6.20 (Carestream Health). Data presentation: mean ± standard deviation of protein tested to actin ratio and representative cropped blots. Statistical analysis: Holm-Sidak's multiple comparisons test; *P<0.05 as indicated.

