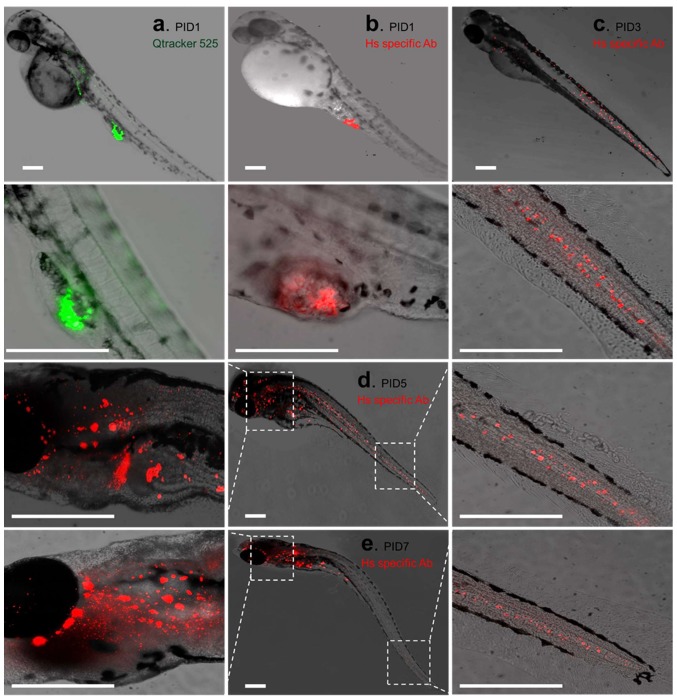
Figure 3.
Migration and proliferation of PC3-CRT cells in vivo. (a) The PC3-CRT cells at PID1 were tracked by the live cell tracking dye Qtracker 525 (green). (b) The PC3-CRT cells in vivo were monitored by immunofluorescent staining by human nucleus specific antibody with Alexa 594 labeled secondary antibody (red). (c) PC3-CRT cell migration and proliferation in vivo at PID3. (d) Signals for PC3-CRT cells in vivo at PID5. Higher magnifications were used to visualize the detailed distributions of PC3-CRT cells at anterior (left) and posterior (right) sections. (e) Distribution of PC3 cells at PID7 in vivo, with higher magnification at anterior (left) and posterior (right) sections. Scale bar, 200 µm.

